#11 Repeat after me
I often repeat myself in class to emphasize a particular point. A prominent example of this is that I ask the same series of questions at the outset of almost every example throughout the entire course, from the first day of class to the last. No doubt some of my students roll their eyes as I ask these same questions over and over and over again. I join in the fun by poking fun at myself as I ask these questions, time after time after time.
What are these questions that I ask so repeatedly as I introduce every example? The answer is so boring that it’s bound to be a big letdown after this long lead-in. I’m almost too embarrassed to tell you. Okay, here goes: What are the observational units and variables in this study? I also ask students to classify the type of variable (categorical or numerical*). If there is more than one variable, I also ask about the role of each variable (explanatory or response). Like I said, very boring. But I ask these questions in class every single day.
* Until very recently, I always said quantitative rather than numerical. But now I have decided that just as many of us have retired qualitative in favor of categorical, we can keep things simpler and more consistent by abandoning quantitative for numerical.
Why do I make such a big deal of repeating these questions for every example? Because students often struggle with knowing what kind of analysis to perform on a given dataset, and the first step toward answering this question is to identify what the observational units and variables are. These questions are fundamental to knowing how to analyze the data: what kind of graph to produce, which statistic(s) to calculate, and what inference procedure to use.
Very early in the course, I ask my students: Consider yourselves as the observational units in a statistical study; classify the following variables as categorical or numerical:
- Whether or not you were born in California
- The day of the week on which you were born
- How many miles you are from where you were born
- How many of the original seven Harry Potter books you have read
- The hand you use to write
- How many minutes of sleep you have gotten in the past 24 hours
- Whether or not you have gotten at least 7 hours of sleep in the past 24 hours
Most students find classifying these variables to be straight-forward, but then I ask: Explain why the following are not variables (still considering yourselves to be observational units):
- Average amount of sleep in the past 24 hours among students in our class
- Proportion of students in our class who are left-handed
Most students find this question to be difficult. I explain that these are summaries that describe our class as a whole, not something that can vary from student to student. If we were to consider classes at our school as the observational units, then we could legitimately consider these to be variables, because these quantities would vary from class to class.
Then I ask: Explain why this question is not a variable:
- Have left-handers read more Harry Potter books, on average, compared to right-handers?
My point here is that this is a research question, not a variable that can be recorded for each student in the class. This research question involves two variables: handedness (categorical) and number of Harry Potter books read (numerical).
I proceed to give students a series of research questions and ask: What are the observational units and variable(s) in a study to address these questions? Here are five examples:
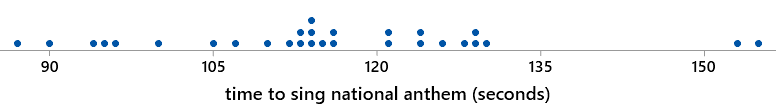
1. How long do singers take to sing the national anthem at the start of the Super Bowl? The observational units here are Super Bowl games. The variable is the time taken for singing the national anthem at the game, which is numerical. Here’s a graph of the data from 1991 through 2019:
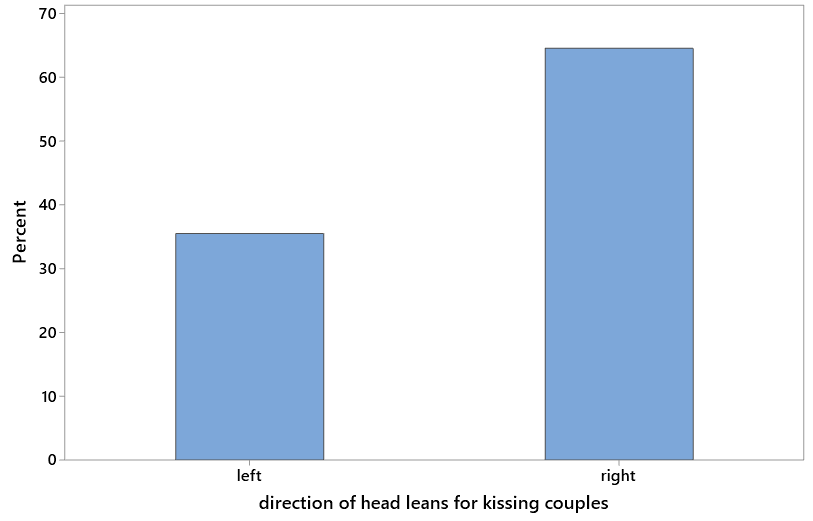
2. What percentage of kissing couples lean their heads to the right? The observational units are kissing couples, not individual people. The variable is the direction in which the couple leans their heads while kissing, which is categorical and binary. A study of this phenomenon published in Nature in 2003 found that 80 of 124 kissing couples leaned their heads to the right, as shown in this graph:
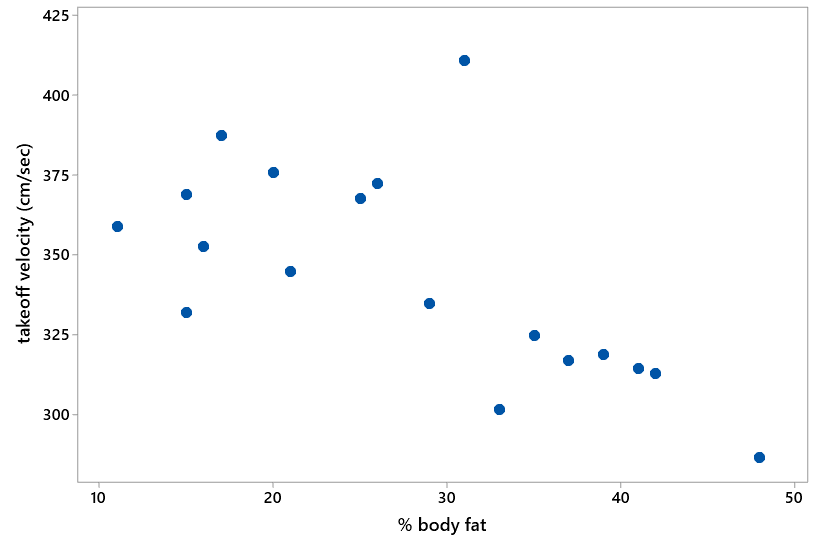
3. Can a cat’s percent body fat be used to predict its takeoff velocity when jumping? The observational units are cats, the explanatory variable is percent body fat, and the response variable is takeoff velocity. Both variables are numerical. Some students get tripped up by percent body fat being numerical, because they mistakenly think that percents are only associated with categorical variables. Researchers investigated this question by collecting data on a sample of domestic housecats, producing the following graph:
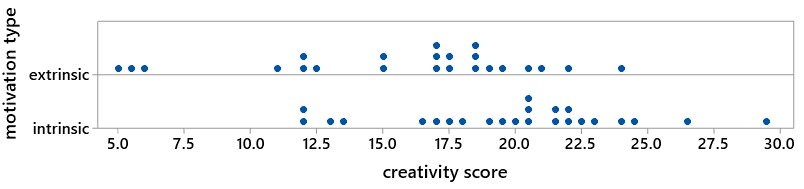
4. Do people display different amounts of creativity depending on whether they experience intrinsic or extrinsic motivation? People with extensive experience with creative writing were randomly assigned to one of two groups: 24 people answered a survey about intrinsic motivations for writing (such as the pleasure of self-expression) and the other 23 people answered a survey about extrinsic motivations (such as public recognition). Then all 47 people were instructed to write a Haiku poem, and these poems were evaluated for creativity on a numerical scale of 0-30 by a panel of judges. The observational units here are the writers. The explanatory variable is the motivation type – intrinsic or extrinsic, which is categorical and binary. The response variable is the creativity score of their Haiku poem, which is numerical. The resulting data are displayed in the following graph*:
* Links to data sources can be found in a P.S. at the end of this post. For now I want to say that I came across these data in The Statistical Sleuth by Ramsey and Schafer. In addition to having the best title of any statistics textbook, the Sleuth also includes this wonderful sentence: Statistics is like grout – the word feels decidedly unpleasant in the mouth, but it describes something essential for holding a mosaic in place.
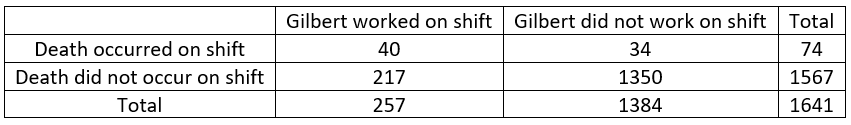
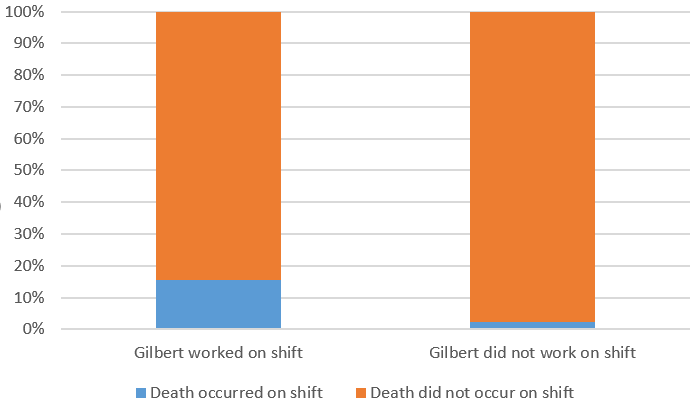
5. Were eight-hour hospital shifts on which Kristen Gilbert worked as a nurse more likely to have a patient death than shifts on which Gilbert did not work? Data on this question were presented in the murder case of Kristen Gilbert, a nurse accused of being a serial killer of patients. Many students are tempted to say that the observational units are patients, but the shifts are the observational units here. The explanatory variable is whether or not Gilbert was working on the shift, which is categorical and binary. The response variable is whether or not a patient died on the shift, which is also categorical and binary. The data are summarized in the table and displayed in the graph below:
Notice that these research questions involve five different scenarios: one numerical variable, one categorical variable, two numerical variables, one variable of each type, and two categorical variables. I draw students’ attention to how the type of graph is different for each scenario. You might also notice that one of these studies (#4) is a randomized experiment, but the others are observational. Another question that I ask repeatedly at the outset of most examples is whether the study involved random sampling, random assignment, both, or neither. I will return to this theme in a future post.
I also like to show Hans Rosling’s video about human progress across 200 countries in 200 years in 4 minutes, and then I present the following “bubble” graph from Rosling’s gapminder software:
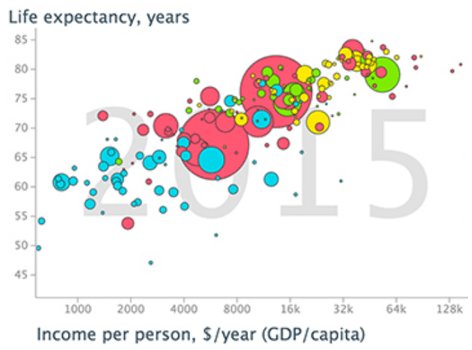
Before we get to interesting questions about this graph, I start with these (boring, repetitive) questions: a) What are the observational units in this graph? b) What variable does Rosling use to represent health? What type of variable is this? Is this the explanatory or response variable in the graph? c) What variable does Rosling use to represent wealth? What type of variable is this? ? Is this the explanatory or response variable in the graph? d) What variable is represented by the color of the dots? What type of variable is this e) What variable is represented by the size of the dots? What type of variable is this?
Everything I’ve described here happens very early in the course, but these questions about observational units and variables keep coming and coming throughout the entire term. When we study five-number summaries and boxplots, first I ask about the observational units and variables in the dataset. When I am ready to introducing scatterplots and correlation and regression, first I ask about the observational units and variables in the dataset. When it’s time to study chi-square tests, first I ask about the observational units and variables in the dataset. You get the idea.
Observational units and variables are especially important when studying sampling distributions. Consider these two graphs, from an activity about sampling words from the Gettysburg Address:
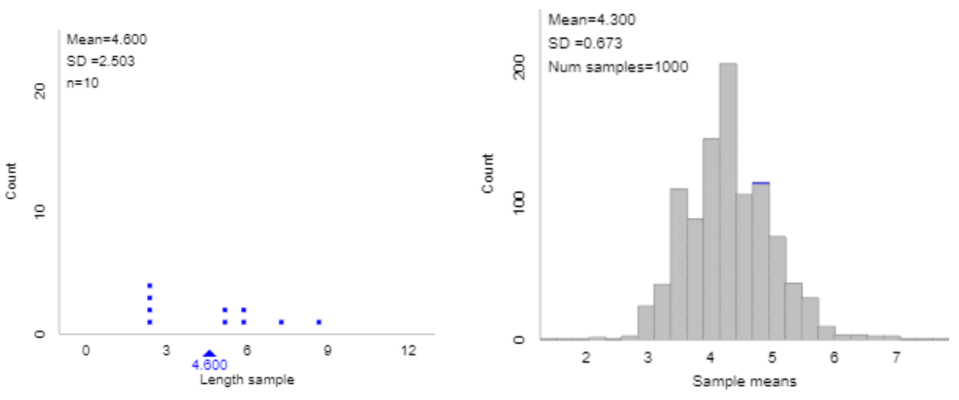
The graph on the left shows the distribution of word length, as measured by number of letters, in a random sample of 10 words. The observational units are words, and the variable (that varies from word to word) is word length. On the other hand, the graph on the right displays the distribution of sample mean word lengths in 1000 random samples of size 10. The observational units now are not individual words but samples of 10 words each, and the variable (that varies from sample to sample) is the sample mean word length. This distinction can be challenging for students to follow, but it’s crucial for understanding what a sampling distribution is.
To assess how well students understand observational units and variables, I ask questions such as the following on assignments, quizzes, and exams:
A1. Suppose that the observational units in a study are patients who entered the emergency room at French Hospital in the previous week. For each of the following, indicate whether it is a categorical variable, a numerical variable, or not a variable with regard to these observational units. a) How long the patient waits to be seen by a medical professional b) Whether or not the patient has health insurance c) Day of the week on which the patient arrives d) Average wait time before the patient is seen by a medical professional e) Whether or not wait times tend to be longer on weekends than weekdays f) Total cost of the emergency room visit
These are fairly straightforward for most students, but some struggle with the ones that are not variables at all (d, e).
A2. Select either all Super Bowl games that have been played or all movies that have won the Academy Award for Best Picture as the observational units in a study. Identify one categorical variable and one numerical variable that could be recorded for these observational units.
This can be a bit tricky for students, in part because the observational units are not people. It’s also naturally harder for students to think up variables for themselves rather than answer questions about variables provided to them.
A3. Researchers studied whether metal bands used for tagging penguins are harmful to their survival. Researchers tagged 100 penguins with RFID chips, and then they randomly assigned half of the penguins to also receive a metal band. Researchers then kept track of which penguins survived throughout the study and which did not. a) Identify the observational units. b) Identify and classify the explanatory variable. c) Identify and classify the response variable.
This question is not especially challenging, but some students have trouble with providing a clear description of the variables. I prefer language such as “whether or not the penguin received a metal band” and “whether or not the penguin survived.” If a student writes “metal band” and “survival,” it’s not clear whether they are describing the variables or one of the outcomes for each variable.
A4. Consider transactions at the on-campus snack bar to be the observational units in a statistical study. State a research question that involves a categorical variable and a numerical variable for these observational units. Also clearly identify and classify the two variables.
I have found that this question is very challenging for students. I now realize that they need lots of practice with coming up with their own research questions. I have in mind answers such as: Do people who pay with cash take longer to serve, on average, compared to people who pay with a card? The explanatory variable is whether the customer pays with cash or card, which is categorical and binary. The response variable is how long the transaction takes to complete, which is numerical.
Let me wrap this up: I know these are boring questions. I frequently say to my students: Like always, let’s answer the boring questions before we get to the interesting parts. I’m truly reluctant to publish this blog post about such boring questions! But I do think these are important questions to ask, and I am convinced that it’s helpful to ask them over and over and over again. I have also come to believe that answering these questions is not as straightforward for students as I used to think. In addition, I hope that students appreciate the interesting research questions and datasets and contexts, which we revisit later in the course, in which I pose these questions.
I forget: Did I mention that I often repeat myself in class to emphasize a particular point?
P.S. The data on Super Bowl national anthem singing times came from here and here. The article about kissing couples can be found here. The article about cat jumping is here. The abstract for the article about motivation and creativity is here. The data about the Kristen Gilbert case came from an article written for Statistics: A Guide to the Unknown (described here) by George Cobb and Steven Gelbach, who were statistical expert witnesses on opposite sides of the case. The Rosling video is available here, and the gapminder software is here. The study about penguin survival can be found here.
Trackbacks & Pingbacks
- #12 Simulation-based inference, part 1 | Ask Good Questions
- #19 Lincoln and Mandela, part 1 | Ask Good Questions
- #20 Lincoln and Mandela, part 2 | Ask Good Questions
- #25 Group quizzes, part 1 | Ask Good Questions
- #26 Group quizzes, part 2 | Ask Good Questions
- #33 Reveal human progress, part 1 | Ask Good Questions
- #43 Confounding, part 1 | Ask Good Questions
- #45 Simulation-based inference, part 3 | Ask Good Questions
- #50 Which tire? | Ask Good Questions
- #52 Top thirteen topics | Ask Good Questions
- #60 Reaching students online | Ask Good Questions
- #66 First step of grading exams | Ask Good Questions
- #71 An SBI quiz | Ask Good Questions
- #73 No notes needed | Ask Good Questions
- #83 Better, not necessarily good | Ask Good Questions
- #85 Three assignments in one | Ask Good Questions


1. I like the idea of substituting “numerical” for quantitative.
2. I wonder about the regular use of “observational units”. Seems OK until we get to A3 on tagging penguins. Is there a danger that students will be confused with calling the4m observational units when this is not an observational study. Should we make the effort to call them experimental units in that case? or is that being overly picky?
LikeLike
Very good question, thanks. I sometimes make a point to say “experimental units” rather than “observational units” with an experiment rather than an observational study, but I don’t make a big deal of that distinction in Stat 101. (I mean the distinction between observational units and experimental units; I certainly do make a big deal of the distinction between experiments and observational studies.)
LikeLike
Thanks so much for these posts…I’ve already used some of your insightful examples in my course this semester! One of the points that is so essential and is difficult for students (and the general populace) to grasp is the difference between controlled, randomized experiments and observational studies and how these relate to causality. That’s my boring, repeated question throughout the course; i.e., what kind of study is this and can we conclude a causal relationship? So now I’ll add your “boring” questions, too! 🙂 Thanks again!
LikeLiked by 1 person
Great post. I thought I was the only one. Check out the test question attached for a non-AP beginning stats class.
*Rich Van Gilst* Statistics Teacher Westminster Christian Academy 636-751-6206 wcastl.org
On Mon, Sep 16, 2019 at 10:06 AM Ask Good Questions wrote:
> allanjrossman posted: ” I often repeat myself in class to emphasize a > particular point. A prominent example of this is that I ask the same > series of questions at the outset of almost every example throughout the > entire course, from the first day of class to the last. ” >
LikeLike
I love that quote from Ramsey and Schafer! I ask the same boring questions as you do on each example and include them sometimes in the homework as well. Some students may roll their eyes, but so many enjoy having something they feel they can answer correctly. I show Rosling’s “Don’t Panic” 1-hour BBC video to every class, have done it for years. He’s long been my hero.
LikeLike