#69 More probability questions
My students and I have spent the last three weeks studying probability*. At the end of Friday’s class session, one of the students asked a great question. Paraphrasing a bit, she asked: We can answer some of these questions by thinking rather than calculating, right? I was delighted by her question and immediately replied: Yes, absolutely! I elaborated that some questions call for calculations, so it’s important to know how to use probability rules and tools. Those questions usually require some thinking as well as calculating. But other questions ask you to think things through without performing calculations. Let me show you some of the questions that I have asked in this unit on probability**.
* This course is the first of a two-course introductory sequence for business students.
** Kevin Ross’s guest post (#54, here) provided many examples of probability questions that do not require calculations.
My students saw the following questions on a quiz near the beginning of the probability unit:
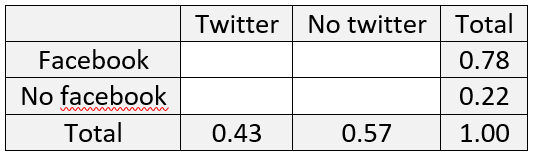
1. Suppose that 78% of the students at a particular college have a Facebook account and 43% have a Twitter account.
- a) Using only this information, what is the largest possible value for the percentage who have both a Facebook account and a Twitter account? Describe the (unrealistic) situation in which this occurs.
- b) Using only this information, what is the smallest possible value for the percentage who have both a Facebook account and a Twitter account? Describe the (unrealistic) situation in which this occurs.
Even though these questions call for a numerical response, and can therefore be auto-graded, they mostly require thinking rather than plugging into a rule. We had worked through a similar example in class, in which I encouraged students to set up a probability table to think through such questions. The marginal probabilities given here produce the following table:
For part (a), students need to realize that the percentage of students with both kinds of accounts cannot be larger than the percentage with either account individually. The largest possible value for that intersection probability is therefore 0.43, so at most 43% of students could have had both kinds of accounts. If this were not an auto-graded quiz, I would have also asked for a description of this (unrealistic) scenario: that every student with a Twitter account also has a Facebook account.
Part (b) is more challenging. A reasonable first thought is that the smallest possible probability could be 0. But then Pr(Facebook or Twitter) would equal 0.78 + 0.43, and 1.21 is certainly not a legitimate probability. That calculation points to the correct answer: Because Pr(Facebook or Twitter) cannot exceed 1, the smallest possible value for Pr(Facebook or Twitter) is 1.21 – 1 = 0.21. At least 21% of students must have both kinds of accounts. This unrealistic scenario requires that every student have a Facebook account or a Twitter account.
Notice that if the two given probabilities had not added up to more than 1, then the smallest possible value for the intersection probability would have been 0%.
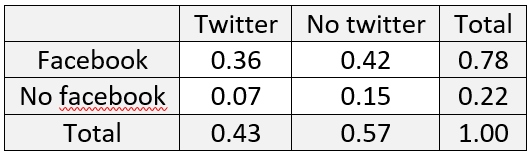
The remaining three parts of the quiz provided students with a specific value (36%) for the percentage of students with both a Facebook and Twitter account and then asked for routine calculations:
- c) What percentage of students have at least one of these accounts?
- d) What percentage of students have neither of these accounts?
- e) What percentage of students have one of these accounts but not both?
These percentages turn out to be 85%, 15%, and 49%, respectively. The easiest way to determine these is to complete the probability table begun above:
The following questions appear on a practice exam that I gave my students to prepare for this coming Friday’s exam:
2. Suppose that a Cal Poly student is selected at random. Define the events E = {randomly selected student is an Engineering major} and T = {randomly selected student is taking STAT 321 this term}. For each of the following pairs of probabilities, indicate which probability is larger, or if the two probabilities are the same value. You might want to consider the following information: A few thousand students at Cal Poly are Engineering majors. A few dozen students are taking STAT 321 this term. Less than a handful of current STAT 321 students are not Engineering majors.
- a) Pr(E), Pr(T)
- b) Pr(E), Pr(E and T)
- c) Pr(T), Pr(E or T)
- d) Pr(E), Pr(E | T)
- e) Pr(T | E), Pr(E | T)
These question requires only thinking, no calculations. I purposefully avoided giving specific numbers at the end of this question.
Part (a) is an easy one, because there a lot more Engineering majors than there are STAT 321 students. For part (b), students are to realize that (E and T) is a subset of E, so Pr(E) must be larger than Pr(E and T). Similarly in part (c), T is a subset of (E or T), so Pr(E or T) must be larger than Pr(T). For part (d), most STAT 321 students are Engineering majors, so Pr(E | T) is larger than Pr(E). Finally, relatively few Engineering majors take STAT 321 in any one term, so Pr(E | T) is also larger than Pr(T | E).
My students completed a fairly long assignment that asked them to apply the multiplication rule for independent events to calculate various probabilities that a system functions successfully, depending on whether components are connected in series (which requires all components to function successfully) or in parallel (which requires at least one component to function successfully). The final two parts of this assignment were:
3. Suppose that three components are connected in a system. Two of the components form a sub-system that is connected in parallel, which means that at least one of these two components must function successfully in order for the sub-system to function successfully. This sub-system is connected in series with the third component, which means that both the sub-system and the third component must function successfully in order for the entire system to function successfully. Suppose that the three components function independently and that the probabilities of functioning successfully for the three components are 0.7, 0.8, and 0.9. Your goal is to connect the system to maximize the probability that the system functions successfully.
- i) Which two components would you select to form the sub-system, and which would you select to be connected in series with the sub-system? Explain your choice.
- j) Determine the probability that the system functions successfully with your choice. Justify the steps of your calculation with the appropriate probability rules.
The first of these questions can be answered without performing calculations. Because the component connected in series must function successfully in order for the system to function successfully, that component should be the most reliable one: the one with probability 0.9 of functioning successfully. The remaining two components, with success probabilities 0.8 and 0.7, should be connected in parallel.
The calculation for part (j) certainly does require applying probability rules correctly. The probability that this system functions successfully can be written as*: Pr[(C7 or C8) and C9]. The multiplication rule for independent events allows us to write this as: Pr(C7 or C8) × Pr(C9). Applying the addition rule on the first term gives: [Pr(C7) + Pr(C8) – Pr(C7 and C8)] × Pr(C9). Then one more application of the multiplication rule gives: [Pr(C7) + Pr(C8) – Pr(C7) × Pr(C8)] × Pr(C9). Plugging in the probability values gives: [0.7 + 0.8 – 0.7×0.8] × 0.9, which is 0.846.
* I’m hoping that my notation here will be clear without my having to define it. I consider this laxness on my part a perk of blog writing as opposed to more formal writing.
Notice that a student could have avoided thinking through the answer to (i) by proceeding directly to (j) and calculating probabilities for all possible arrangements of the components. I do not condone that strategy, but I do encourage students to answer probability questions in multiple ways to check their work. The other two probabilities (for the system functioning successfully) turn out to be 0.776 if the 0.8 probability component is connected in series and 0.686 if the 0.7 probability component is connected in series.
Finally, here’s the in-class example that prompted my student’s question at the top of this blog post:
4. Suppose that Zane has a 20% chance of earning a score of 0 and an 80% chance of earning a score of 5 when he takes a quiz. Suppose also that Zane must choose between two options for calculating an overall quiz score: Option A is to take one quiz and multiply the score by 10, Option B is to take ten (independent) quizzes and add their scores.
- a) Which option would you encourage Zane to take? Explain.
- b) Which option do you suspect has a larger expected value, or do you suspect that the expected values will be the same?
- c) Use properties of expected value to determine the expected value of his overall score with each option. Comment on how they compare.
- d) Which option do you suspect has a larger standard deviation, or do you suspect that the standard deviations will be the same?
- e) Use properties of variance to determine the standard deviation of his overall score with each option. Comment on how they compare.
- f) If Zane’s goal is to maximize his probability of obtaining an overall score of 50 points, which option should he select? Explain.
- g) Calculate the probability, for each option, that Zane scores 50 points. Comment on how they compare.
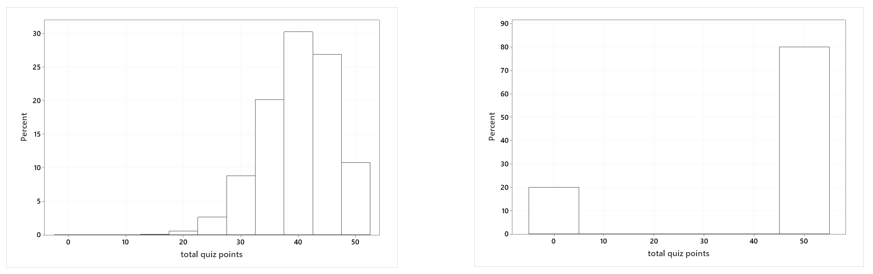
- h) The following graphs display the probability distributions of Zane’s overall quiz score with these two options. Which graph goes with which option? Explain.
The key idea here is that multiplying a single quiz score by 10 is a much riskier, all-or-nothing proposition than adding scores for 10 independent quizzes. A secondary goal is for students to learn how to apply rules of expected values and variances to multiples and sums of random variables.
The expected value of Zane’s score on a single quiz is 4.0, and the standard deviation of his score on a single quiz is 2.0. The expected value of the random variable (10×Z) is the same as for the random variable (Z1 + Z2 + … + Z10), namely 40.0 quiz points. This means that neither option is better for Zane in terms of long-run average.
But this certainly does not mean that the two options yield identical distributions of results. The variance of (10×Z) is 102 × 4.0 = 400, so the standard deviation is 20.0. The variance for (Z1 + Z2 + … + Z10) is much smaller: 10 × 4.0 = 40, so the standard deviation is approximately 6.325.
Zane has an 80% chance of obtaining an overall quiz score of 50 with option A, because he simply needs to score a 5 on one quiz. With option B, he only achieves a perfect overall score of 50 if he earns a 5 on all 10 quizzes, which has probability (0.8)10 ≈ 0.107.
The graph on the left above shows the probability distribution for option B, and the graph on the right corresponds to option A. The graphs reveal the key idea that option A is all-or-nothing, while option B provides more consistency in Zane’s overall quiz score.
The great mathematician Laplace reportedly said that “probability theory is nothing but common sense reduced to calculations.” I wish I had thought quickly enough on my feet to mention this in response to my student’s comment in class on Friday. I’ll have to settle for hoping that my probability questions lead students to develop a habit of mind to think clearly and carefully about randomness and uncertainty, along with the ability to perform probability calculations.


Thanks again for sharing. I love these!
LikeLike