#88 It’s about time, part 2

In last week’s post (here), I presented some examples and questions through which I introduce my students to time series data. I left off with a bit of a cliff-hanger, as I presented the following graph of national average prices, by month, for a gallon of unleaded gasoline:
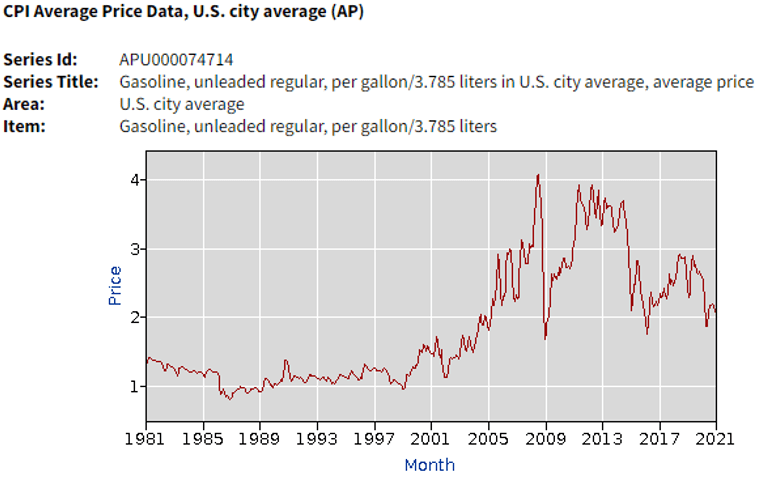
As you can see, this series begins in January of 1981, during my first year of college*, and concludes in January of 2021, the first year of college for most of my current students.
* I mentioned last time that January of 1981 feels like a frighteningly long time ago. I’m sorry to report that this feeling has not subsided in the past week. In fact, January of 1981 feels even longer ago this week than it did last week.
The national average price of a gallon of unleaded gasoline increased from $1.298 in January of 1981 to $2.326 forty years later. I ask my students: Calculate the percentage increase. This works out to be a (2.326 – 1.298) / 1.298 × 100% ≈ 79.2% increase. Then I ask: Does gasoline really cost this much more now than in my first year of college? This is where last week’s post ended.
The answer I am seeking for that question is: Not really. To which I respond with: Why not? Because a dollar was worth more, in terms of what it could buy, back in 1981 than it is worth now. This realization leads into the topic of converting from current to constant dollars, also known as adjusting for inflation.
I have to admit that this is one of my favorite topics to teach. I truly feel like I’m teaching my students a valuable skill when I show them how to adjust and compare monetary values at different points in time. Why do I feel somewhat guilty about enjoying this topic? Because it’s not really statistical. I have learned to assuage my guilt with three thoughts:
- Analyzing time series data about prices that cover multiple years requires adjusting for inflation to make meaningful comparisons.
- The U.S. Bureau of Labor Statistics (BLS) uses lots of statistical methods, primarily associated with sampling, to determine the Consumer Price Index (CPI) on which such adjustments depend.
- If I’m helping my students to learn an idea and skill that are valuable, interesting, and even fun, who cares about whether it’s labeled as math or statistics or something else?
The Consumer Price Index (CPI) is based on prices for items that most people buy on a regular basis, gathered from urban areas around the U.S. Monthly values of the CPI back to January of 1913 can be found from the BLS site here*. The key idea for converting a monetary value from one time to its equivalent value at another time is to multiply by the ratio of the CPI values: value at time B = value at time A × (CPI at time B) / (CPI at time A).
* I provide a link to an Excel file containing these monthly CPI values at the end of this post.
Convert the $1.298 average national price of a gallon of gasoline in January 1981 into the equivalent price in January 2021. The value of the CPI was 87.0 in January 1981 and 261.582 in January 2021. This conversion is: $1.298 × (261.582/87.0) ≈ $1.298 × 3.007 ≈ $3.903.
Interpret what the converted value means. In terms of the buying power of today’s (well, January 2021’s) dollar, the amount of $1.298 in January of 1981 is equivalent to $3.903 now.
In which month – January 1981 or January 2021 – did it really cost more for a gallon of unleaded gasoline, after adjusting for inflation? Explain your answer. The January 2021 average price of $2.326 is considerably less than the January 1981 price after its conversion to the equivalent of January 2021 dollars. So, gasoline actually cost more, in terms of the buying power of currency at the time, in January 1981 than in January 2021.
Calculate the percentage difference of the two prices, after adjusting for inflation, using January 1981 as the baseline. Also write a sentence interpreting this value. This calculation is:(2.326 – 3.903) / 3.903 × 100% ≈ -40.4%. In terms of constant dollars, the January 2021 price is about 40.4% less than the January 1981 price.
Next I ask students: Convert the entire time series of gasoline prices into constant dollars as of January 2021. Produce a graph of these converted prices, along with the original prices. Comment on what the graph reveals about how the price of gasoline has changed over these four decades.
This conversion is conceptually straight-forward: We simply need to apply the same calculation as for January 1981 to all 481 months in the series. This task requires using software and is well-suited for a spreadsheet package such as Excel*.
* The data on gasoline prices can be found in an Excel file at the end of this post.
On the left is the formula for using Excel to perform the conversion of the January 1981 price into constant dollar as of January 2021. On the right is the result of entering that formula:
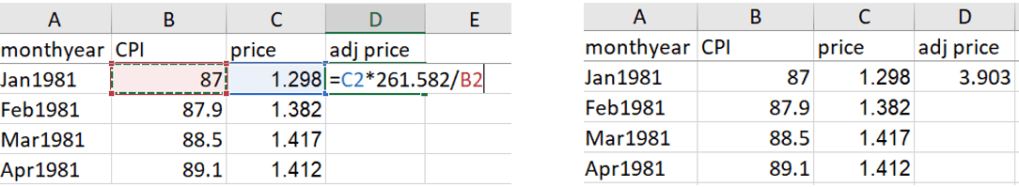
Filling that formula down for the entire column produces the following results at the bottom:

I often encourage students to ask questions of themselves to check their work. A good example is: Does the adjusted price for January 2021 make sense? Yes! Because we’re converting all prices to constant dollars as of January 2021, the price should (and does) stay the same for that month.
Produce graphs of these two series for easy comparison. This results in:
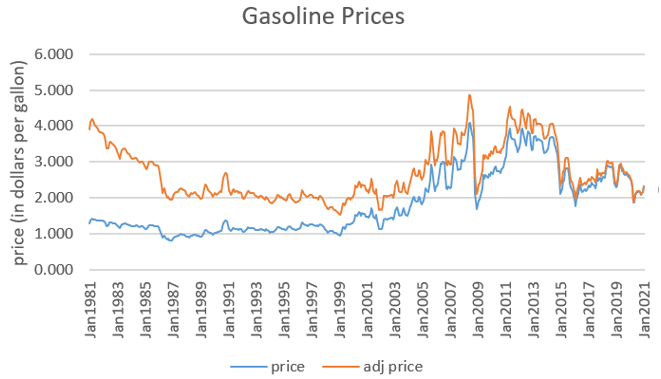
Describe what the graph reveals. Whereas the original series (in blue) shows a fairly constant price for gasoline through the 1980s and 1990s, the series of converted prices (in orange) shows that the inflation-adjusted prices decreased in these decades. Both series reveal an increase in the price of gasoline in the first decade of the 2000s, aside from a fairly dramatic price drop in 2008. Notice that the two series converge in the 2010s, because much less of an adjustment for inflation is needed as the time gets closer to the present.
I also like to ask students to use CPI values to calculate and compare inflation rates by decade. First: Starting with the 1910s and ending with the 2010s, which decade do you predict to have the lowest rate of inflation? Which do you predict to have the highest rate of inflation? Then I give them the following table and ask: Calculate the inflation rate for each decade. If they need a hint: Calculate the percentage change in the CPI for each decade.

Here are the inflation rates for these decades:

Describe how the inflation rate has varied over the past ten decades. The 1920s and 1930s experienced negative inflation. Inflation surged in the 1940s and then slowed in the 1950s and 1960s. Inflation exploded in the 1970s, as the CPI more than doubled in that decade. Since then, the inflation rate has decreased more and more with each passing decade.
Now for some exam questions that I have asked on this topic:
My annual salary when I began my career as a college professor in September of 1989 (when the CPI was 125.00) was $27,000. If my salary kept pace with inflation but otherwise did not increase, what would my salary be today (as of January 2021)? This calculation is straight-forward: $27,000 × (261.582 / 125.0) ≈ $27,000 × 2.093 ≈ $56,501.71.
In the television series The Rockford Files, private investigator Jim Rockford charged $200/day for his services in the year 1975 (when the CPI was 53.8). In the novel P is for Peril by Sue Grafton, detective Kinsey Millhone charged $400/day for her services in the year 1986 (in which the CPI was 109.6). After adjusting for inflation, who charged more for their daily fee – Rockford or Millhone? Justify your answer with a sentence accompanied by appropriate calculations.
This question is more challenging than the previous one, because it does not specifically ask students to perform a particular price adjustment. Students need to decide for themselves what to calculate to answer this question. Several reasonable options are available. Students could convert Rockford’s fee into constant 1986 dollars, or they could convert Millhone’s fee into constant 1975 dollars. A third option is to convert both fees into constant dollars for some other time, such as January 2021. This gives $200 × (261.582 / 53.8) ≈ $972.42 for Rockford’s fee in constant January 2021 dollars, compared to $400 × (261.582 / 109.6) ≈ $954.68 for Millhone’s fee. These are remarkably similar, but Rockford’s fee is slightly larger than Millhone’s after converting to comparable dollars.
Finally, mostly for fun but also to award a point for paying minimal attention, I sometimes ask: What does CPI stand for? [Options: Consumer price index, Capital product inflation, Cats project integrity]
I always find adjusting for inflation to be a fun topic to teach, worthwhile for students to learn. I take advantage of a brief unit on time series to sneak this topic into my course. I also enjoy the opportunity to give students practice with basic spreadsheet skills. I hope their quantitative and computational skills will help them to earn starting salaries that exceed $27,000 from 1989, even after adjusting for inflation.
P.S. Files containing data on CPI values and gasoline prices can be accessed from the links below:

