#96 Fostering collaborative learning online

This guest post has been contributed by Anelise Sabbag. You can contact her at asabbag@calpoly.edu.
Anelise Sabbag is a colleague of mine in the Statistics Department at Cal Poly – San Luis Obispo. She earned her Ph.D. in the field of statistics education at the University of Minnesota. Anelise regularly teaches our course for prospective teachers, as well as many other statistics courses, and she also conducts research into how students learn statistics. She began teaching online, and studying how students learn effectively online, well before the pandemic forced many of us to teach remotely. I am delighted that Anelise agreed to write this guest blog post about fostering collaborative learning in online courses.
Now that we have been teaching online for a few terms, some of you might be starting to consider the possibility of teaching online occasionally in the future. Maybe you have realized that online teaching is not as bad as you feared. One of the most challenging aspects is facilitating interactions among students’ online, which you may not have had time to think about as you were forced into online teaching during a pandemic. But maybe you have time to consider this now that you are a bit more used to teaching online. So, the question that I address in this blog post is: How can you encourage student-to-student interactions in your online asynchronous course?
This can be done in a variety of ways, through forum discussions and wiki assignments. But I would like to share with you another simple way to do this: a google doc file with a few good statistics questions and a collaborative structure. The “good questions” part seems to be pretty well covered in this blog already, so let’s explore a bit the idea of creating a collaborative structure in an assignment.
The idea of a collaborative structure is based on cooperative learning theory. The idea is to create an assignment that requires students to work in groups but also establishes positive interdependence among the students to encourage them to work together effectively. A collaborative structure starts with a common goal. That famous expression about “sinking or swimming together” is what we want students to understand. The success of the group is tied to the success of each student in the group. A common goal could be to require students to provide an answer to each of the good statistical questions you selected and inform the students that their responses will be graded as a group. The number of questions is really up to you. In my course, I ask about 7-8 questions per assignment, but because of time constraints I end up grading 3-4 of the questions. But having a collaborative assignment with one good question might be enough in your first attempt, until you figure out how much interesting information you can derive from these assignments. Then you might add more questions for your next iteration. But starting slowly always helps, right?
Here is an example of what I am talking about: In post #19 (here), Allan addressed the concepts of sampling bias and random sampling. The activity covered in this post asks students to read the Gettysburg Address and circle ten words as a representative sample from this passage. For each word in the sample, students are asked to record how many letters are in the word, calculate the average number of letters per word in the sample, and plot their sample average on a dotplot on the board, along with the sample averages of their classmates. Students then reflect on what they see in the dotplot and eventually conclude (or we hope they do) that this sampling method is biased. After this part of the activity, Allan suggests asking this question to students: Would asking people to circle twenty words (rather than ten) eliminate, or at least reduce, the sampling bias? I asked a very similar question in my class, and here is the final group answer for one of the groups:
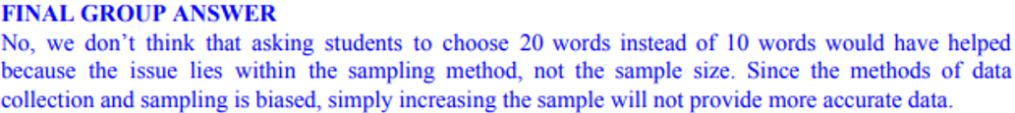
This looks like a good answer, right?! It seems students are recognizing that the issue is really the sampling method and so increasing the sample size would not help. So, the students in this group were able to accomplish the shared goal of providing a strong group answer to this question.
But don’t you wish you could see the students’ thought process and interactions that led to this answer? Of course you do! At this point we have no clue about whether students worked together to get to this final answer. It could be that one student just wrote this answer and didn’t even discuss it with their group members. So, the collaborative structure of the assignment is not reflected in this final group answer. We need more!
The answer I showed above is the last step of a three-step process in my collaborative assignments. Now I will tell you what happens before that. We need to create a structure in the assignment that encourages students to get to that final group answer through collaboration and discussion. We could ask them to get together on Zoom and discuss (remember that the structure here is an online asynchronous class). But we might have several issues with that approach. First, students need to find a time that they can all get together at the same time. That could already be tricky depending on the number of students in the group. Another issue we might face is student participation in this online discussion. Some students might not be willing to participate, perhaps because they are shy or maybe because they do not care. (Yeah, it is hard to admit that some students, especially in a general education course, do not really care about our beloved introductory statistics course.) So, if there is a way for students to do less work in the course, some of them will unfortunately choose that route. The issue then becomes individual accountability. Even though students are working together, we still want to hold them accountable for their individual work. So why not ask students to answer the questions individually first and then share their individual response with their group? Here are the initial answers that eventually led to the final group answer above:
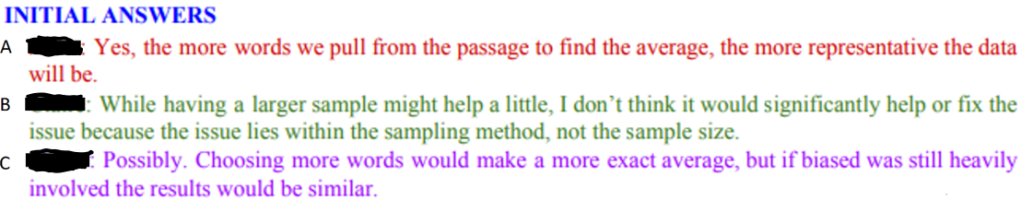
Now we can see that the three students were not all on the right track initially. Student A, like many students in introductory statistics courses, might be thinking that a larger sample size leads to a representative sample. This student is most likely ignoring whether the sampling method is biased or not. Student B has the best answer compared to the other two answers. She does recognize that the issue is still the biased sampling method used. Her first comment, though, makes me want to ask a follow up question: In what way do you think increasing the sample size “might help a little”? I am hoping that this student would talk about precision, which would be great. Though she might talk about accuracy, which would not make me so happy because that is an incorrect connection (larger sample size leads to more accuracy when estimating the parameter of interest) that many students make. I think that Student C is moving toward this mistake when she says that the larger sample size would make the average more exact. This student then contradicts this first idea at the end of her sentence when stating that the results would be similar. If I could, I would ask her: How can the average be more exact and the results still be similar? By the way, I never did ask these questions as I am not “involved” in this part of the assignment. At this point, students only share the google doc file with their group members.
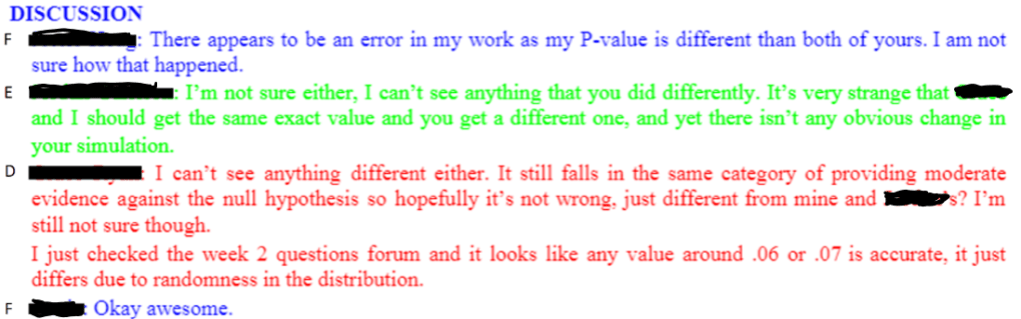
While asking students to provide initial answers might help students to be individually accountable, we are still stuck with the issue of students needing to find a time that they can all get together at the same time. So, why not make the discussion asynchronous? Even better, why not make this a written discussion? In this way you could get more insight into students’ thought processes. Using a google doc file can make this very straightforward. Students start by posting their initial answers in the file and sharing with their group members. Then they can have some sort of discussion about these answers to come up with a final group answer. Here is the discussion that the students had to get to final answer above:

This discussion is not as thoughtful as you might want, but it’s still interesting. The student who gave the right answer earlier is now helping the other students to understand what they might have missed. Of course, this is not the same help that a professor would give to a student, but you still see some interesting interactions. Student A, who was the one displaying worst understanding in the initial answer, seems to now be paying more attention to the sampling method, which she failed to do before. Student C also seems to be on the right track now, but this student could be just re-stating Student B’s answers. Or maybe this student finally understood that increasing the sample size will not account for the bias in the sampling method.
Of course, you are not always going to see thoughtful and encouraging discussions. Ideally, we hope that once all initial answers are provided, students will read and compare their answers, identify and correct mistakes so that they can finally end with a final group answer that is correct. The amount of interaction you see might depend on how specific your instructions are. You could require a minimum number of words in the discussion section or that every student should provide at least two contributions to the discussion.
Sometimes you might see a disappointing discussion, because students are not able to identify which answers are correct/incorrect as they are still unclear about the material. So, while students are completing this collaborative assignment, I release video(s) to help them. Please note that the statistical questions I use in these collaborative assignments are part of activities that students are required to complete individually first (and submit for grading based on completion). Usually, the activity consists of 30-40 questions, but the collaborative assignment is composed of only 7-8 of those questions. So, the videos that I release to students refer to the most important aspects of the activity and might include examples of typical mistakes students usually make. Students report that these videos are very helpful resources for them to complete these collaborative assignments. In addition to these videos, I also have “question forums” through which students can post any questions they might have about the assignments they are completing. Sometimes these also become helpful resources to students (see example below).
One important aspect in these assignments is to provide questions that could inspire discussion, or questions for which you think students might struggle and reach different answers. But even if students end up with similar and correct answers, you might still get some good interactions. For instance, a basic question that many of us are already asking our students is to calculate a p-value and show their work. In the example below, students noticed that they used the same correct inputs in the simulation but ended up with slightly different p-values. They were a bit stuck on this and looked at the “question forum” to get some help, where they noticed that some students already posted a question about this. At the end maybe they were able to recognize the role of random chance in their simulations.

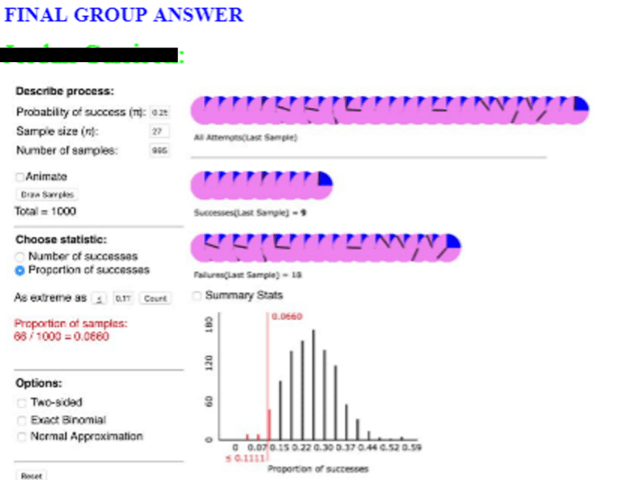
Here is another example of a collaborative assignment using one of the questions that Allan suggests in post #41 (here). When students are conducting a simulation-based analysis, we want to make sure that they know what they are doing and are not just blindly following instructions. So, we can simply ask: What does each of the 1000 dots represent? I asked a similar question in an activity that guides students in examining whether dogs understand human cues (this activity is from the textbook used in my course: Introduction to Statistical Investigations by Tintle et al). To test this, an experimenter performed some sort of gesture (pointing, bowing, looking) toward one of two cups. The researchers then saw whether the dog would go to the cup that was indicated. Students are presented with the performance of a dog named Harley, who was tested 10 times and chose the correct cup for 9 of those times. One of the earlier questions in the activity shows an example of a student (Julia) flipping a coin 10 times to simulate the process of Harley randomly choosing between the cups. For each set of 10 flips, Julia records the number of heads. She repeats this process 11 times and creates the following dotplot:
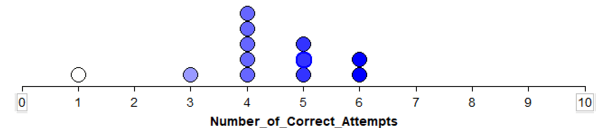
Students are then asked: Using the context of the problem, explain what a dot on the plot represents.
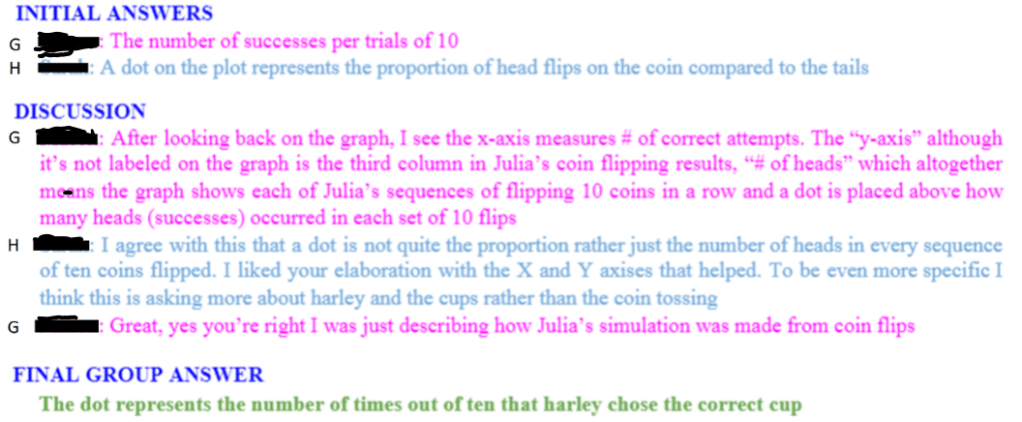
In this example, we see students reflecting on their own answers and also going back to the question that was asked and the information (dotplot) provided to them. Students were able to help each other differentiate between the proportion and count of success and also bring in the context of the problem to their final answer, which none of them did initially. This is an example of a group containing only two students (the third group member dropped the class). In my experience, these collaborative assignments work better in groups of 3 (which would also help with the amount of time grading), but this group was mostly successful throughout the quarter.
In my course, students are randomly put into groups at the beginning of the quarter. The first week of class is focused heavily on getting to know each other, clarifying expectation of work individually and as a group, and creating an individual and group schedule for the remainder of the quarter. These first week assignments are essential in an online course! I believe we must help students recognize that their success in an online course is tied to their organization and schedule. I also believe that these beginning “organize yourself and your group” assignments set the stage for helpful and constructive group interactions. And I believe this is why I usually do not have “group problems” in my course, and students end up working with their group through the whole quarter. The more we help the group to get to know each other and work together, the more they will help each other and learn together. To encourage positive group interactions, you could even offer them a group reward. For instance, if all students in the group do well on the individual homework at the end of the week, then everyone in the group will receive an extra credit point.
I hope this post can give you some ideas of how to provide your online students with opportunities to work together. I have high hopes that you will be pleasantly surprised with what you will see.

