#5 A below-average joke
I sometimes joke that when I moved from Pennsylvania to California, the average IQ dropped in both states*. Then I follow up in class with my students (after the uproarious laughter subsides) by asking:
Is it actually possible, in principle anyway, for the average IQ to decrease in both states when a person moves from Pennsylvania to California? If so, what would have to be true for this to happen?
I encourage students to think about this for a minute and then discuss it with someone nearby. I want students to realize that this phenomenon could in fact happen, provided that my IQ was greater than the average IQ in Pennsylvania and less than the average IQ in California.
* For my friends and blog followers in Pennsylvania, please forgive me! You are quite welcome to tell your students that the average IQ increased in both states when I moved. You might begin the story by saying “a statistics-teacher-who-seems-to-think-he’s-funny-but-actually-isn’t sometimes jokes that when he moved …”.
Here’s a follow-up question:
Let’s say that my average class size in Pennsylvania was 24 students per class, and my average class size in California has been 36 students per class. Does it therefore follow that the average class size across my teaching career has been 30 students, the average of 24 and 36? What additional information (if any) is needed to determine the overall average?
This question is more challenging than the previous one. Again I urge students to discuss this with each other, and most come to recognize that calculating an overall average by taking the average of two group averages will only work if the two groups have the same sample size.
Then I tell my students that I have taught for more years in California (18) than in Pennsylvania (12), and I also teach more classes per year in California than I did in Pennsylvania. This leads to my asking:
Is the average class size for my career is closer to 24 or 36 students per class?
Because I have taught more classes in California than I did in Pennsylvania, the average class size for my career will be closer to the California average of 36 students per class than the Pennsylvania average of 24.
I realize that these questions might not work as well for you, lacking the autobiographical element. My point is that even though students begin to learn about averages in early grades, we can ask good questions that lead students to understand more subtle properties of how averages work. Here are some more questions along these lines:
Suppose that the average (mean) house price in a community is $425,000. Does it follow that half of the houses cost more than $425,000?
No, this does not follow. Half of the houses would cost more than the median, but the mean could be quite different from the median.
Do you suspect that more or less than 50% of the houses cost more than the average (mean), and why? (Hint: Think about the likely shape for the distribution of house prices.)
This question requires a lot more thought than the previous one. The distribution of house prices is likely to be skewed to the right, because some houses cost millions of dollars whereas there’s a lower bound on how little a house can cost (zero, for an extreme lower bound). With a skewed right distribution, the mean is typically greater than the median, so less than 50% of the houses would cost more than the mean.
Is it possible for 90% of a company’s employees to earn less than the average (mean) salary in the company?
Yes. A few outliers on the high end, or a strong enough right skew of the salary distribution, could pull up the mean so much that a large majority of employees earn less than the average salary.
Is this possibility only a mathematical curiosity, or is it actually quite plausible?
This is quite plausible, because the salaries of a few highly paid executives could make this happen.
Construct a hypothetical example for a company with ten employees to illustrate this property.
Some students find this to be challenging, and I again encourage them to discuss it in groups. We can construct a fairly simple example by supposing that the company president earns a salary of $500K (K = thousand) per year and her nine employees each earn a salary of $100K per year. Then the sum of these salaries (in thousands of dollars) is 500K + 9×100K = 1400K, which produces an average of 1400K/10 = 140K dollars. All nine of the employees earning $100K earn less than the average, so 90% of the employees earn less than the average.
Now let’s consider a more challenging set of questions in a context with which students have considerable experience: class sizes. Suppose that a total of 150 students at a college are taking a statistics course. The college offers five sections of the course, each taught by a different instructor. The class sizes are shown in the following table and graph:
| Section | A | B | C | D | E |
| Number of students | 15 | 15 | 15 | 15 | 90 |
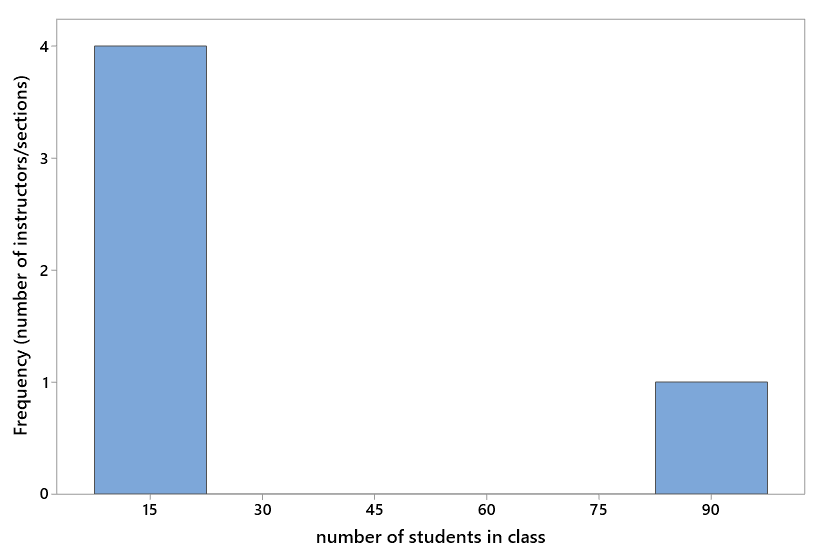
Think about the average class size (number of students in a class) at the college.
What is the average class size, per instructor, across the five instructors?
This one is easy: The total number of students is 90 + 15 + 15 + 15 + 15 = 150, so the average class size per instructor (or per section) is 150/50 = 30 students. The college can truthfully advertise 30 as its average class size.
Now look at class size from the students’ perspective. Across these 150 students, what is the average size, per student, of their statistics class?
This is much harder. We now need to consider 150 data values, with each student reporting how many students are in their statistics class. The graph of this distribution is very different from the previous one:
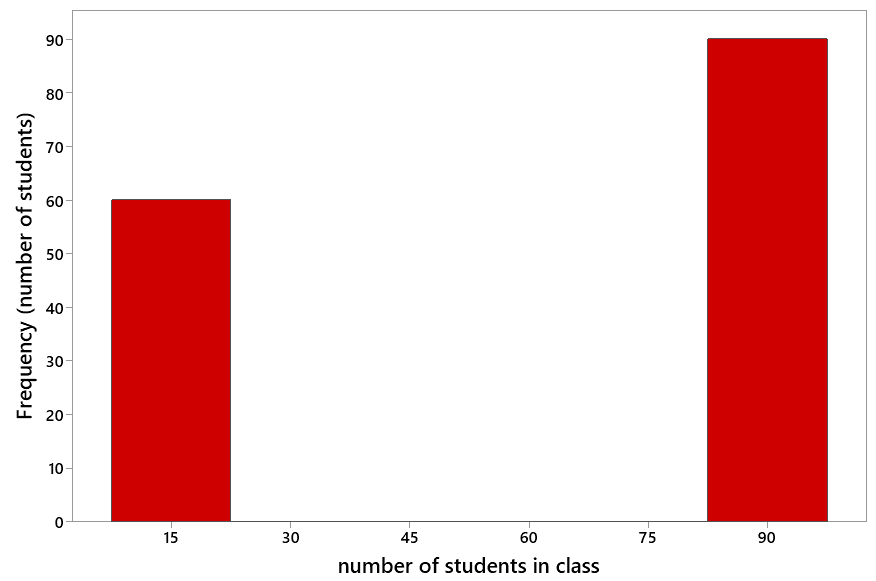
Whereas the previous graph (with sections/instructors as the observational units) was heavily weighted toward the low end of 15 students in a class, this new graph (with individual students as the observational units) is weighted more toward the high end with 90 students in a class. We can anticipate that the average class size will now be much larger than it was before. You might want to remind students at this point that the mean/average can be thought of as the balance point of the distribution.
Calculating the average requires adding up the 150 values, which sounds quite daunting, but let’s think it through:
- The 90 students in Class A all have 90 students in their class, so all 90 of these students will report the value 90. Adding up these 90 values of 90 gives 90×90 = 8100.
- The other 60 students (in Classes B-E) all have 15 students in their class, so all 60 of these students will report the value 15. Adding up these 60 values of 15 gives 60×15 = 900.
- The sum of these class size values for the entire group of 150 students is therefore 8100 + 900 = 9000.
- Dividing by 150 to calculate the average gives 9000/150 = 60 students in an average class, from the students’ perspective.
Comment on how these two average class sizes compare, and explain why they differ as they do. Which average would you say is more relevant?
From the students’ perspective, the average class size is not even close to 30! In fact, it’s twice that size. Some students (60 of them, which is 40% of the total of 150 students) have the benefit of a small class size of 15. But most students (90 of them, which is 60% of the students) are stuck in a large class of 90 students. In other words, most students would be pretty seriously misled if they chose this college based on the advertised average class size of 30 students per class. From the students’ perspective, it seems that 60 is the more relevant average to report.
How many of the 150 students are in a class with the average class size, for either version of the average?
Zero. None of the 150 students are in a 30-student class or a 60-student class. They are all in either a 90-student class or a 15-student class. This again illustrates, as we emphasized in the previous post (here), that averages are of limited value because they say nothing about variability and nothing about the distribution.
Calculate the median class size from each perspective. Comment on how the medians compare to each other and to the averages (means).
From the perspective of the five instructors, the median class size is 15. From the perspective of the 150 students, the median class size is 90. The median is considerably less than the mean from the instructors’ perspective, and the median is much greater than the mean from the students’ perspective.
What’s the point of my asking these questions about class size?
- We can ask questions about averages that get beyond basic calculations, leading students to explore and develop an understanding of the concept of averages. Focusing on conceptual understanding is the second GAISE recommendation (here), after the recommendation to teach statistical thinking that was emphasized in posts #3 and #4.
- We always need to be careful with our language, especially to make clear what the observational units in a statistical study are. In this case, we need to be clear about whether the observational units are the five instructors/sections or the 150 students. The analysis of average class size differs considerably depending on which perspective we take We can ask questions about averages that get beyond basic calculations and lead students to explore and understand more complicated aspects of averages.
- As I emphasized in the previous post about cancer pamphlets (here), measures of center don’t tell the whole story. Variability is crucial to consider, and distribution also matters a lot. We can ask questions about averages that get beyond basic calculations and lead students to explore and understand more complicated aspects of averages.
P.S. I first read about calculating average class sizes from both students’ and instructors’ perspectives in a review of introductory textbooks by George Cobb that appeared in JASA in 1987. George praised a textbook by Wonnacott and Wonnacott for including questions about this. George’s review made a big impact on my teaching career, particularly his mantra, repeated throughout the review: Judge a book by its exercises, and you cannot go far wrong. This sage advice strongly influenced the development of my teaching philosophy*.
* In case you missed it: Ask good questions.


I’m from Pennsylvania, and I use the same below-average joke/example. But I make it about Swarthmore and [a college that is a rival of Swarthmore, which I will not name here].
LikeLike
I love your IQ example. I am going to try it for the first time in my it to stats class. Will keep you posted how it went !
LikeLike
as someone who has written about average class size (https://tandfonline.com/doi/abs/10.1080/10691898.2011.11889621), I appreciate your concise and engaging examples on this!
LikeLike