#95 Independence day, part 1
One of my favorite class sessions when I teach probability is the day that we study independent events. This post will feature questions that I pose to students on this topic, which (as usual) appear in italics.
I introduce conditional probability and independence with some real data that Beth Chance and I collected in 1998, when the America Film Institute unveiled a list of what they considered the top 100 American films (see the list here). Beth and I tallied up which films we had seen and produced the following table of counts:

Suppose that one of these 100 films is selected at random, meaning that each of the 100 films is equally likely to be selected.
- a) What is the probability that Beth has seen the film?
- b) Given the partial information that Allan has seen the film, what is the updated (conditional) probability that Beth has seen it?
- c) Does learning that Allan has seen the randomly selected film change the probability that Beth has seen it? In which direction? Why might this make sense?
- d) Repeat this analysis based on the following table (of made-up data) for two other people, Cho and Dwayne:

These probabilities are Pr(B) = 59/100 = 0.59 and Pr(B|A) = 42/48 = 0.875. Learning that Allan has seen the film increases the probability that Beth has seen it considerably. On the other hand, learning that Cho has seen the film does not change the probability that Dwayne has seen it: Pr(D) = 60/100 = 0.60 and Pr(D|C) = 42/70 =0.60.
- e) In which case (Allan-Beth) or (Cho-Dwayne) would it make sense to say that the events are independent?
This question is my attempt to lead students to define the term independent events for themselves, without simply copying what I say or reading what the textbook says. Dwayne’s having seen the film is independent of Cho’s having seen it, because the probability that Dwayne has seen the film does not change upon learning that Cho has seen it. But Beth’s having seen the film is not independent of Allan’s having seen it, because her probability changes in light of that partial information about the film.
- f) Based on these data, would you still say that (Allan having seen the film) and (Beth having seen the film) are dependent events, even if they never saw any films together and perhaps did not even know each other?
This question points to a fairly challenging idea for students to grasp. Probabilistic dependence does not require a literal or physical connection between the events. In this case, even if Allan and Beth did not know each other, being a similar age or having similar tastes could explain the substantial overlap in which films they have seen. Similarly, Cho and Dwayne might have watched some films together, but the data reveal that their movie-watching habits are probabilistically independent.
My next example gives students more practice with identifying independent and dependent events, in the most generic context imaginable: rolling a pair of fair, six-sided dice. Let’s assume that one die is green and the other red, so we can tell them apart.
Consider these four events: A = {green die lands on 6}, B = {red die lands on 5}, C = {sum equals 11}, D = {sum equals 7}. For each pair of events, determine whether or not the events are independent. Justify your answers with appropriate probability calculations.
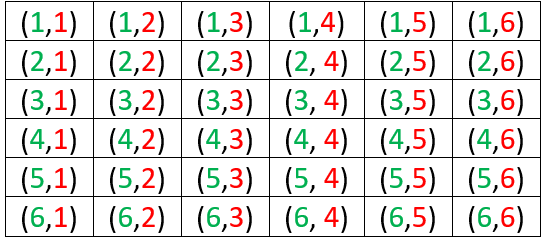
Here is the sample space of 36 equally likely outcomes:

We know that A and B are independent events, because we assume that rolling two fair dice means to roll them independently, so the outcome for one die has no effect on the outcome for the other. The calculations are Pr(A) = 1/6, Pr(B) = 1/6, Pr(A|B) = 6/36 = 1/6, and Pr(B|A) = 6/36 = 1/6.
It makes sense that A and C are not independent, because learning that the green die lands on 6 increases the chance that the sum equals 11. The calculations are: P(C) = 2/36 = 1/18 and Pr(C|A) = 6/36 = 1/6. From the other perspective, Pr(A) = 1/6 and Pr(A|C) = 1/2, because learning that the sum is 11 leaves a 50-50 chance for whether the green die landed on 6 or 5. The events B and C are also dependent, for the same reason and with the same probabilities.
Some students are surprised to work out the probabilities and find that A and D are independent. We can calculate Pr(D) = 6/36 = 1/6 and Pr(D|A) = 1/6. This conditional probability comes from restricting our attention to the last row of the sample space, where the green die lands on 6. Even though the outcome of the green die is certainly relevant to what the sum turns out to be, the sum has a 1/6 chance of equaling 7 no matter what number the green die lands on. Similarly, B and D are also independent.
The events C and D also make an interesting case. Some students find the correct answer to be obvious, while others struggle to understand the correct answer after it’s explained to them. I like to offer this hint: If you learn that the sum equals 7, how likely is it that the sum equals 11? I want them to say that the sum certainly does not equal 11 if the sum equals 7. Then I follow up with: So, does learning that the sum equals 7 change the probability that the sum equals 11? Yes, the probability that the sum equals 11 becomes zero!* These events C and D are definitely not independent, because Pr(D) = 2/36 but Pr(D|C) = 0, which is quite different from 2/36.
* Be careful not to read this as zero-factorial**.
** I never get tired of this joke.
Next I show students that if E and F are independent events, then Pr(E and F) = Pr(E) × Pr(F). Then I provide an example in which we assume that events are independent and calculate additional probabilities based on that assumption.
Suppose that you have applied to two internship programs E and F. Based on your research about how competitive the programs are and how strong your application is, you believe that you have a 60% chance of being accepted for program E and an 80% chance of being accepted for program F. Assume that your acceptance into one program is independent of your acceptance into the other program.
- a) What is the probability that you will be accepted by both programs?
- b) What is the probability that you will be accepted by at least one of the two programs? Show two different ways to calculate this.
Part (a) is as simple as they come: Pr(E and F) = Pr(E) × Pr(F) = 0.6 × 0.8 = 0.48*. For part (b), we could use the addition rule: Pr(E or F) = Pr(E) + Pr(F) – Pr(E and F) = 0.6 + 0.8 – 0.48 = 0.92. We could also use the complement rule and the multiplication rule for independent events, because complements of independent events are also independent: Pr(E or F) = 1 – Pr(not E and not F) = 1 – Pr(not E) × Pr(not F) = 1 – 0.4 × 0.2 = 0.92. I like to specify that students should solve this in two different ways. I go on to encourage them to develop a habit of looking for multiple ways to solve probability problems in general. Students could also solve this by producing a probability table:

* You probably noticed that I was a bit lax with notation here. I am using E to denote the event that you are accepted into program E. Depending on the student audience, I might or might not emphasize this point.
Next I mention that the multiplication rule generalizes to any number of independent events. Then I ask: Now suppose that you also apply to programs G and H, for which you believe your probabilities of acceptance are 0.7 and 0.2, respectively. Continue to assume that all acceptance decisions are independent of all others.
- c) What is the probability that you will be accepted by all four programs? Is this pretty unlikely?
- d) What is the probability that you will be accepted by at least one of the four programs? Is this very likely?
Again part (c) is quite straightforward: Pr(E and F and G and H) = Pr(E) × Pr(F) × Pr(G) × Pr(H) = 0.6 × 0.8 × 0.7 × 0.2 = 0.0672. This is pretty unlikely, less than a 7% chance, largely because of applying to very competitive program H. Part (d) provides much better news: Pr(E or F or G or H) = 1 – Pr(not E and not F and not G and not H) = 1 – Pr(not E) × Pr(not F) × Pr(not G) × Pr(not H) = 1 – 0.4 × 0.2 × 0.3 × 0.8 = 0.9808. You have a very good chance, better than 98%, of being accepted into at least one program.
- e) Explain why the assumption of independence is probably not reasonable in this situation.
Even though the people who administer these scholarship programs would not be comparing notes on applicants or colluding in any way, learning that you were accepted into one program probably increases the probability that you’ll be accepted by another, because they probably have similar criteria and standards. It’s plausible to believe that learning that you were accepted by one school makes it more likely that you’ll be accepted by the other, as compared to your uncertainty before learning about your acceptance to the first school. This means that the calculations we’ve done should not be taken too seriously, because they relied completely on the assumption of independence.
Next I ask students to consider a context in which independence is much more reasonable to assume and justify:
Suppose that every day you play a lottery game in which a three-digit number is randomly selected. Your probability of winning for each day is 1/1000.
- a) Is it reasonable to assume that whether you win or lose is independent from day to day? Explain.
- b) Determine the probability that you win at least once in a 7-day week. Report your answer with five decimal places. Also explain why this probability is not exactly equal to 7/1000.
- c) Determine the probability that you win at least once in a 365-day year.
- d) Suppose that your friend says that because there are only 1000 three-digit numbers, you’re guaranteed to win once if you play for 1000 days. How would you respond?
- e) Express the probability of winning at least once as a function of the number of days that you play. Also produce a graph of this function, from 1 to 3652 days (about 10 years). Describe the function’s behavior.
- f) For how many days would you have to play in order to have at least a 90% chance of winning at least once? How many years is this?
- g) Suppose that the lottery game costs $1 to play and pays $500 when you win. If you were to play for that many days (your answer to the previous part), is it likely that you would end up with more or less money than you started with?
Because the three-digit lottery number is selected at random each day, whether or not you win on any given day does not affect the probability of winning on any other day, so your results are independent from day to day.
We will use the complement rule and the multiplication rule for independent events throughout this example: Pr(win at least once) = 1 – Pr(lose every day) = 1 – (0.999)n, where n represents the number of days. For a 7-day week in part (b), this produces Pr(win at least once) = 1 – (0.999)7 ≈ 0.00698. Notice that this is very slightly less than 7/1000, which is what we would get if we added 0.001 to itself for the seven days. Adding these probabilities does not (quite) work because the events are not mutually exclusive, because it’s possible that you could win on more than one day. But it’s extremely unlikely that you would win on more than one day, so this probability is quite close to 0.007. I specifically asked students to report five decimal places in their answer just to see that the probability is not exactly 0.007*.
* I like to refer to this as a James Bond probability.
For the 365-day year in part (c), we find: Pr(win at least once) = 1 – (0.999)365 ≈ 0.306. The friend’s argument in part (d) about being guaranteed to win if you play for 1000 days is not legitimate, because it’s certainly possible that you would lose on all 1000 days. In fact, that unhappy prospect is not terribly unlikely: Pr(win at least once) = 1 – (0.999)1000 ≈ 0.632 is greater than one-half but much closer to one-half than to one!*
* Feel free to read this as one-factorial.
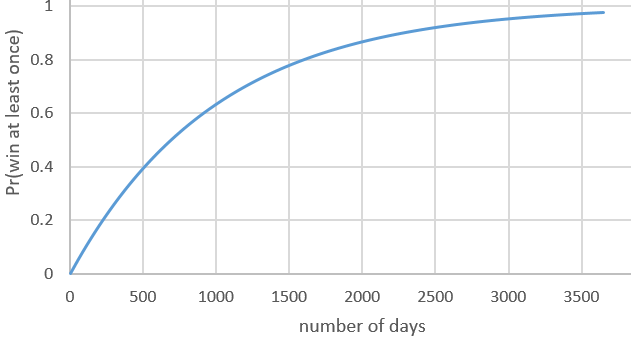
Here’s the graph requested in part (e) for the function Pr(win at least once) = 1 – (0.999)n:

This function is increasing, of course, because your probability of winning at least once increases as the number of days increases. But the graph is concave down, meaning that the rate of increase gradually decreases as time goes on. The probability of winning at least once reaches 0.974 after 10 years of playing every day.
Part (f) asks us to solve the inequality 1 – (0.999)n ≥ 0.9. We can see from the graph that the number of days n needs to be between 2000 and 2500. Examining the spreadsheet in which I performed the calculations and produced the graph reveals that we need n ≥ 2302 days in order to have at least a 90% chance of winning at least once. This is equivalent to 2302/365.25 ≈ 6.3 years. If you’d like your students to work with logarithms, you could ask them to solve the inequality analytically. Taking the log of both sides of (0.999)n ≤ 0.1 and solving, remembering to flip the inequality when diving by a negative number, gives: n ≥ log(0.1) / log(0.999) ≈ 2301.434 days.
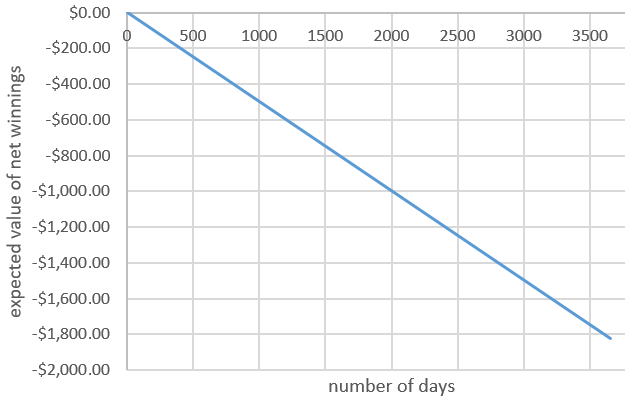
I included part (g) just to make sure that students realize that winning at least once does not mean coming out ahead of where you started financially. At this point of the course, we have not yet studied random variables and expected values, but I give students a preview of coming attractions by showing this graph of the expected value of your net winnings as a function of the number of days that you play*:

* The expected value of net winnings for one day is (-1)(0.999) + (500)(.001) = -0.499, so the expected value of net winnings after n days is -0.499 × n.
I still have not gotten to my favorite example for independence day, but this post is already long enough. That example will have to wait for part 2 of this post, which will not be independent of this first part in any sense of the word.

Trackbacks & Pingbacks