#49 My favorite problem, part 3

In the past two posts (here and here), I have described my favorite problem and how I present it to students at many levels. The problem is to determine the optimal strategy for hiring an employee subject to several restrictive conditions, and also to examine what happens to the probability of successfully choosing the best candidate as the number of candidates increases. Here’s a reminder of the outline for this three-part series:
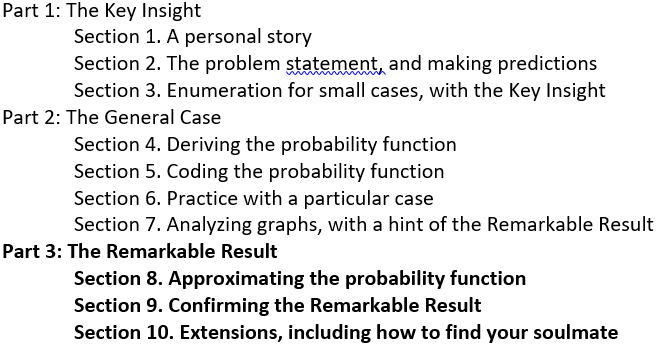
In part 1, we experienced a revelation that I termed the Key Insight: We can optimize our probability of choosing the best by using information about the quality of candidates who appear early in the interviewing process. We followed this up in part 2 by deriving a probability function for any number of candidates, and we used some R code to evaluate this function for several specific values. What we learned provided a hint of a Remarkable Result, in that the probability of success remained as high as 0.368 even with 5000 candidates to choose among, as shown in the following table:

As we conclude this series in this post, we will explore how the optimal strategy, and its probability of success change as the number of candidates becomes extremely large. To do this, we’ll use some ideas and tools from single-variable calculus. For students who have not studied calculus, I ask them to follow along as best they can. They can still experience the Remarkable Result even if they do not follow all of the mathematical details that confirm it.
As always, questions that I pose to students appear in italics.
8. Approximating the probability function with calculus
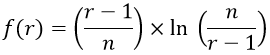
Here’s the probability function that we derived (recall that n represents the number of candidates, and (r – 1) is the number of candidates that you let go by before you start to consider hiring one):
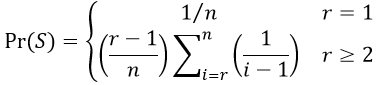
For very large values of n, we have many terms in that sum, and we also need to evaluate this function for many values of r. These calculations can take a while even with a fast computer. It would be very helpful to find a simpler function that could approximate our exact probability function well.
What calculus tool can we use to approximate that sum? When students need a hint, I ask: What are the primary calculus “things” that you learn about in the first term or two of your calculus series? Most students identify derivatives and integrals as two of the most prominent things they learn about in calculus, and some realize that an integral can be thought of as the continuous version of a discrete sum. We can use the following approximation:
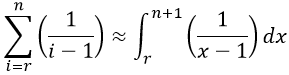
Evaluate this integral. Some students remember that this integral leads to a natural log function, as follows:

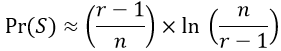
Use this result to approximate the probability function. Substituting this log function for the sum gives:
How well does this function approximate the exact probability function? I used R to evaluate both functions, for all values of r, with a few different values of n. The graphs below display the exact probabilities with a solid dot, the approximate probabilities with an open diamond:
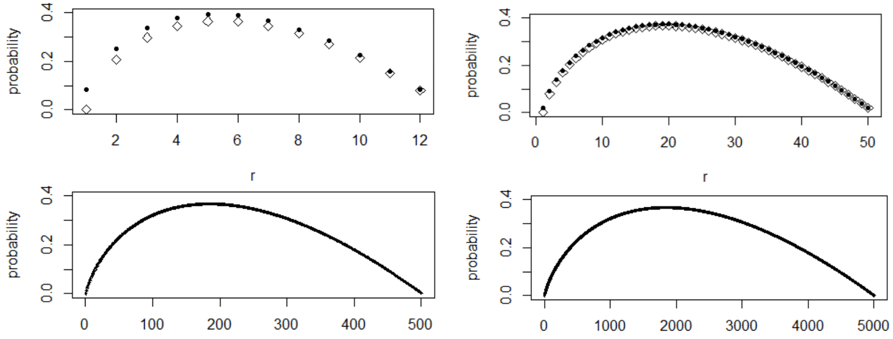
The graphs in the top row show that the approximation does poorly when n = 12, better but not great when n = 50. The graphs in the bottom row reveal that the approximation performs very well when n = 500 and n = 5000. We can feel quite comfortable using the approximation for our purpose, which involves much larger values than n = 5000.
9. Confirming the Remarkable Result
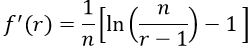
Remember our goal: For a given number of candidates (n), we want to determine the value of r that maximizes the probability of successfully choosing the best. Now we have an approximate function for this probability, which we need to maximize. What calculus tool can we use to determine the value of r that maximizes this function? At this point, most of my students know that we can use the derivative for this purpose. Consider again this function:
Take the derivative of this function with respect to r. When students give me a blank stare, I ask: What derivative rule do we need to use? If they still do not respond, I follow up with: Remind me what the × symbol means. Some students roll their eyes and say times. I ask for a slightly bigger word and wait for someone to say product, and then someone calls out that we need the product rule. When students get to the part with the natural log, I again ask what rule we need and wait until someone says the chain rule. Finally, we need the quotient rule to work with the argument of the natural log function*.
* I think it’s a lot of fun that we get to use the product, quotient, and chain rules to take this derivative. Not all of my students agree.
I give students a few minutes to evaluate this derivative and check their answers with each other. After applying the product, quotient, and chain rules, the derivative simplifies to:
What do we do next with this derivative? Some students need a reminder: Why did we bother to evaluate this derivative in the first place? We’re trying to determine the value of r that maximizes this function. What do we do with the function’s derivative to determine where the function is maximized? Set the derivative equal to zero. And then …? Solve. Solve for what? Solve for the value of r. Then I give students a few minutes to do this.
Setting this derivative equal to zero produces:
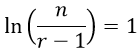
Solving for r gives:

Based on this result, describe the optimal strategy with a very large number of candidates. Remember that (r – 1) is the number of candidates that we let pass before we consider hiring one. This result says that the optimal strategy is to let n/e of the candidates go by. Because 1/e ≈ 0.3679, this means that we should let 36.79% go by, and then hire the first candidate you see who is the best so far.
Describe how to determine the probability of successfully choosing the best with this optimal strategy. We can approximate this probability very well by plugging the optimal value of r into the function f(r). In other words, we need to evaluate f(n/e + 1).
Evaluate this probability. This function gives:
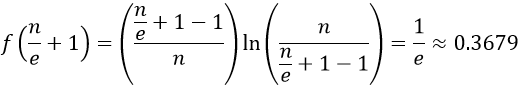
Interpret this probability. By using the optimal strategy, even with an extremely large number of candidates, you have a 36.79% chance of successfully choosing the best. In other words, if you use this strategy over and over again, you will successfully choose the best candidate in about 36.79% of all job searches.
Is this finding remarkable? Yes!!* I urge students not to allow all of this mathematics and calculus to divert their attention from what we’ve just discovered: The probability of successfully choosing the best candidate does not approach zero as the number of candidates gets very large. In fact, this probability does not even come close to zero. Instead, it approaches, and never dips below, 1/e, which is about 0.3679. This is very close to the optimal probability with 5000 candidates that we discovered at the end of the previous post. So, the probability that you successfully choose the best candidate is essentially the same whether you have 5 thousand candidates or 7.8 billion candidates. Yes, most emphatically, that’s remarkable!
* Earning full credit for this answer requires using at least two exclamation points!
This finding is all the more amazing when you consider that there’s about a 37% chance that the best candidate will be in the initial group that you do not even consider hiring. The conditional probability that you successfully choose the best candidate, given that the best candidate does not appear in that initial group, is therefore .3679 / .6321 ≈ 0.582. In other words, given that this strategy allows you any chance to find the best candidate, there’s a 58.2% chance that you will succeed.
10. Extensions, including how to find your soulmate in life
We’ve now completed the solution to my favorite problem, but I’m enjoying this too much to stop just yet. Now I’ll present two fun applications to situations other than hiring an employee. With the first one, you can amaze your friends. The second one just might help you to find your soulmate in life.
Consider this game: Give 50 blank index cards to some friends, and ask them to write one number, unseen by you, on each card. The numbers can be as small or as large as they like. When they have the 50 cards with 50 numbers, they need to remember what the largest number is and then shuffle the cards thoroughly. The game is that your friends will reveal the numbers on the cards to you one at a time, and your task is to tell them immediately when you think you’ve seen the largest number in the whole stack. Before you start, make sure that your friends appreciate how remarkable it will be if you can succeed at this! Remind them that you have no idea how large or small the numbers are, and you’re trying to identify the largest one at the very moment that you first see it.
What strategy should you use? Well, this game is essentially the same as the “choosing the best” problem, right? We found in the previous post (here) that the optimal value is r = 19 when n = 50. So, you should let the first 18 numbers go by. All you have to keep track of is the largest number you see among those first 18. Then as soon as you see a larger number than that, immediately declare in dramatic fashion: That’s the largest number in the whole stack!
What’s the probability that you’ll be right? According to the R code we ran for the previous post, this probability is about 0.3743. Granted, if you play this game repeatedly, you’ll be right less than half the time in the long run, but you’ll be right more than one-third of the time. Considering how challenging the task sounds, that success rate should be often enough to amaze your friends.
* If you’re so inclined, you could ask for 2-to-1 odds on a small wager, and you’ll come out with a positive profit if you play enough times. You might even persuade your friends to offer higher odds than that.
Now consider a much more important challenge in life: finding your soulmate. Everyone wants to find the very best person in the whole world for them, right? Nobody sets out to find someone among the top 40% of all possible life partners; you want the very best. Think about how this process plays out: You meet people one at a time, and you have to decide somewhat quickly about whether you’d like to spend substantial time with the person. The optimal strategy that we discovered says that you should let the first 37% of potential soulmates go by, and then propose to the first one you find who is the best so far.
One complication is that you don’t know in advance exactly how many potential soulmates you’ll meet. But you might consider ages 18-36 to be your years for conducting this search, and 18/e ≈ 6.62 years. So, you should let potential soulmates pass between the ages of 18 and 24.62 years. After that age, once you find one who is the best so far, try to convince them that they should consider you as their soulmate. Of course, this points out a second and more important complication: Even if you succeed in finding the very best person for you, they may or may not reciprocate your assessment.
Thanks very much for joining me on this very long* journey through my favorite problem. I admitted at the outset that this problem is not particularly realistic, but I find it a lot of fun to explore. I particularly enjoy that we employed many aspects of probabilistic and mathematical thinking. We used “brute force” enumeration and counting to analyze small cases, which led to the Key Insight that propelled us through the rest of the analysis. Then we used more counting principles to figure out the general case, and we wrote some code that enabled us to tackle a large number of cases. The resulting graphs pointed to a Remarkable Result, which we confirmed by applying some calculus.
* This series has exceeded 9000 words.
P.S. I mentioned in section 1 of this series that I first heard about this problem from Morrie DeGroot. You can read more about this problem in his textbooks Optimal Statistical Decisions and Probability and Statistics. I also recommend the article “Who Solved the Secretary Problem?” by Thomas Ferguson (here).

