#60 Reaching students online
This guest post has been contributed by Kelly Spoon. You can contact her at kspoon@sdccd.edu.
Kelly Spoon teaches statistics in San Diego, at a two-year college (San Diego Mesa College) and for an AP Statistics class (Torah High School of San Diego). I met Kelly through twitter (@KellyMSpoon), where she shares lots of ideas about teaching statistics and mathematics, and at the AMATYC conference in Milwaukee last fall. Kelly has since hosted me to give a workshop for her colleagues in San Diego and to conduct a review session for her AP Statistics students via zoom. Kelly is very passionate about teaching statistics, dedicated to helping all students succeed, and knowledgeable about content and pedagogy. I am very glad that she agreed to contribute this guest blog post on the very timely topic of teaching statistics (and reaching students) online*.
* Speaking of timely, my first taste of online teaching will begin three weeks from today.
When Allan asked if I would write a guest blog post, I didn’t hesitate to email back with an emphatic yes. Not only because I owe him for presenting to faculty at my college AND doing a review for my AP Statistics students, but because I’m always excited to share my passion for teaching statistics.
Then the actual writing started, and I immediately regretted this decision. There’s just too much to share in such a short space. In the end, I wrote an entirely too long blog post for which Allan suggested some minor edits to fit a theme of fearlessness. I asked myself: What does it mean to teach fearlessly?
To me, the broadest definition is a willingness to thoughtfully try new things – whether tools, policies, assessments, or formats. And at this point, most of us fit that definition by the circumstances of distance learning that have been thrust upon us. Now that I’m a week into a new completely online semester, my previous draft felt like it was missing what most of us want to know right now: How do we teach statistics online?
After having a successful first week of the new fall term that mostly gave me energy rather than leaving me feeling drained (as most of last spring’s emergency remote classes did), I thought I’d share some insights as to how I made that first week work for me. To keep with the theme of this blog, these insights are presented as answers to questions that you might ask yourself as you’re designing your online statistics course. I hope these questions are generic enough to stand the test of time to remain relevant when we’re back in a classroom.
1. Cultivating curiosity
Knowing where you want to end up (your desired outcomes) is crucial when designing a course or individual lesson, but the starting point is sometimes overlooked. As you think about your course, whether you’re meeting in person, on Zoom, or you don’t have scheduled meetings, ask yourself: Does my lesson plan make students want to learn more?
This is where Allan’s blog comes in handy. He has many great examples of good questions that truly spark curiosity, often without requiring a deep understanding of the subject matter to start. However, simply including good questions in a lecture allows students to opt out and wait for the professor or another student to do the thinking for them. Simulation-based inference and the many awesome applets that exist in that same vein are one great way to build curiosity for theory-based inference. Regardless of class modality, one of my favorite tools for sparking curiosity is the activity builder in Desmos.
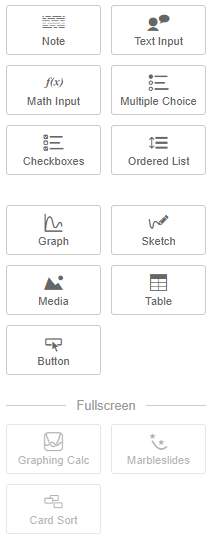
If you haven’t tried out the Desmos Activity Builder (here), you’re missing out. This one tool can answer questions such as: How do I do activities if I’m teaching online? What if I want to assign activities as homework? What if I don’t want to buy Hershey’s Kisses to make confidence intervals for the proportion that land on their base? The Desmos activity builder allows you to add math, graphs, tables, video, images, text to slides for students to work through. You can have students input math, graphs, tables, text, answer multiple choice, multiple selection, reorder selections, even doodle on a graph or image. That was quite the list. See the image below for a visual of all the things you can add to an activity in Desmos:
On the instructor end, you can see exactly where students are (so it’s great to use if you’re meeting with students at a particular time which we all now know is called synchronous) – I use this to pause the activity and debrief when most students have reached a particular point or nudge those students who seem to be stalled. You can also see student work in real-time and provide them feedback directly in the activity. And many activities have been designed to combine data from across the entire class, allowing you to recreate some favorite in-person activities in an online space.
Here are a few Desmos activities that I’ve created, used, or plan to use to build curiosity:
a) Reading Graphs (here)
This activity was inspired by a workshop on culturally responsive teaching. These graphs and questions appear in my lecture notes before we discuss displays for data. Typically, I have students work in groups of four to answer all of the questions for their graph. Then we do a numbered-head protocol (they number themselves 1-4, and I use a random number generator on the projector to choose a victim to report out) to debrief the activity. I show them that they already know most everything in that section of the lecture notes, with the added bonus of being able to bring in topical graphs*, including ones on social justice issues. For my asynchronous classes, students go through this activity on their own but can see other student responses once they share. For my synchronous class, I occasionally “pause” the activity to discuss some of the responses to a particular graph. For instance, the following bar chart of children in poor families leads to so many more questions than answers: What defines a family as poor? Are the observational units the children or the families? Does it matter? What if the parents have different education levels? Where are the other 8%?!
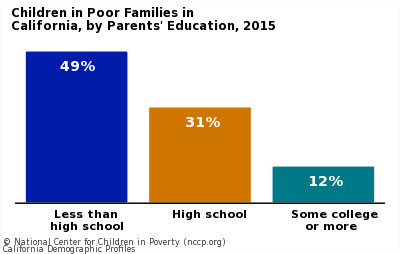
* Please ignore the titanic mosaic plot; I really haven’t found better.
b) Skew the Script – Lesson 1.1 (here)
I just found this activity, despite being a longtime fangirl of @AnkerMath on twitter. Skew the Script (here) has a great curriculum created for AP Statistics with student and instructor resources that strive to make the content relevant. It focuses on using real-world examples and creating equity-driven lessons. This particular exercise has students analyze and describe the problems with a lot of bad graphs. I plan on starting off the 2nd week with this one! I’ll tweet how it goes.
c) Does Beyoncé Write Her Own Songs? (here)
This activity is taken entirely from StatsMedic (here) and adapted for Desmos by Richard Hung (find him on twitter here). StatsMedic is built on a framework of “experience first, formalize later” (EFFL), so their entire curriculum – which they provide for free on their site – is inherently designed to build curiosity. For this particular activity, I’ve edited it a bit to bring in some Allan-inspired questions, like identifying observational units and variables (see post #11, Repeat after me, here). This activity is a variation of Allan’s Gettysburg Address activity (see post #19, Lincoln and Mandela, part 1, here) or the Random Rectangles* activity, and is great for building understanding of sampling bias, random sampling, and sampling distributions.
*I first did the Random Rectangles activity in a workshop conducted by Roxy Peck ; it apparently originated in Activity-Based Statistics by Scheaffer et al.
I believe lectures inherently kill curiosity – even a lecture with questions interspersed for this purpose. Students know that eventually you will tell them the answer, and many will sit and wait until someone else does the work. At least in my flipped classroom, these types of activities incentivize my students to go watch those lectures by making them curious enough to want to know more. As a bonus, I can keep referring back to that tangible activity: Remember when you placed your magnet on the class dotplot in the Random Rectangles activity?
2. Building a collaborative and safe learning environment
So, we can present good questions or well-designed activities to ignite that sense of wonder in our students, but we also need the students to feel connected to each other and to us as educators, especially in an online environment. That brings me to my next question: Am I providing opportunities for students to connect with and learn from one another?
In a traditional classroom, these opportunities may happen organically. Students may chat before class or set up study groups, even if our classes don’t explicitly carve out time for collaboration. In an online class, these moments need to be constructed and provided for students.
Using Google slides with breakout rooms in Zoom is my go-to for collaboration between students in an online environment. For those of you unfamiliar with Google Slides, they are essentially Google’s version of PowerPoint. The bonus is that you can get a shareable link that allows anyone to edit the slides – even if they don’t have a google account! They just have to click the link, and then they are editing simultaneously. My typical setup is to create a slide for each group within one shared presentation. The slides contain the instructions about what the students should add to the slide to complete the activity. Here are a few of the activities I’ve already used in class:
a) Personality Coordinates
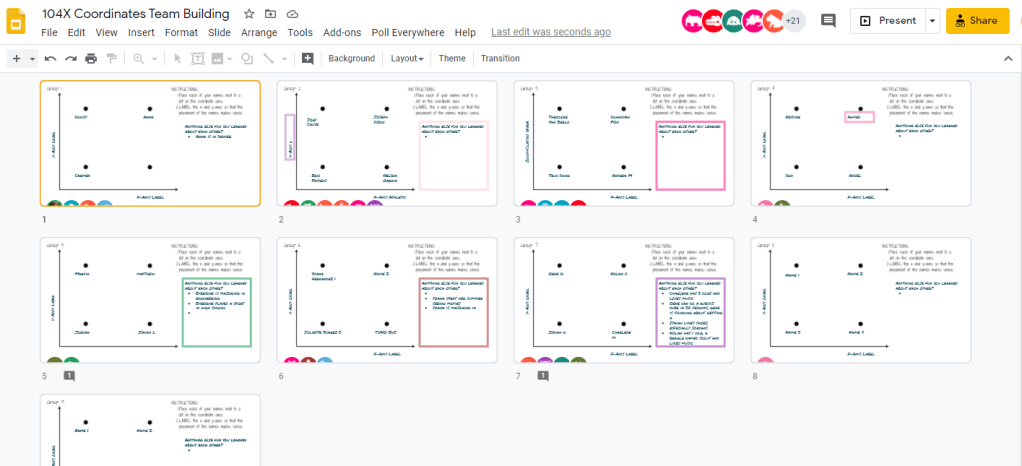
This activity is an ice-breaker – before you roll your eyes, let me finish! – where students put their names on four points and then have to work together to label the X and Y axes. I personally can tolerate this particular ice-breaker because it serves as a needed review of a coordinate plane that I can reference again when we start looking at scatterplots. You can read more about this activity where I originally found out about it on Dan Meyer’s blog (here).
In the image below, you’ll see the circle representing students on slides of the presentation and the highlighted areas are what students are working on. Slides make it easy at a glance to check that students are making progress and let you know which groups you should check in on. There’s even a comment feature so you can provide quick feedback without being too intrusive. If you want to know more about how I ran this activity, check out this twitter thread (here), where I provide the links to the slidedeck and instructions I presented before putting students in breakout rooms.
b) Sampling IRL
This particular activity is a discussion board in my fully online asynchronous class. However, in my synchronous class that meets on Zoom, I saved myself a lot of grading by creating a slide deck in the same vein. On day 1, students worked with a group to fill in a slide with how they would attempt to collect a sample from a given population (students at my college, students at all area community colleges, Starbucks customers, adults in our city).
Based on timing, the second half of this activity happened on the following day, which also allowed me to reformat the slides and add new questions. On Day 2, I moved each breakout room to a new slide and they had to answer two questions:
- Could you follow the sampling scheme that the group laid out? If not, what is unclear?
- Are there any groups of people who might be left out based on their sampling scheme? Who are they? What type of people from the population will be under/over represented?
In this particular example, I didn’t reinvent anything, I just took an existing prompt and turned it into a collaborative activity by having students answer these questions in groups. And again, the added bonus was that I only needed to grade 8 slides as opposed to 32 discussion posts!
I have loved using this type of activity in my classes. Previously I did a lot of similar activities in face-to-face classes utilizing giant post-its or just the whiteboards around class. I do like that Google slides allows these contributions to be saved to come back to. Here are some things I’ve found that help this run smoothly:
- Provide roles for the breakout rooms – students don’t have to use them, but it sets expectations. You can see my slide with roles below:
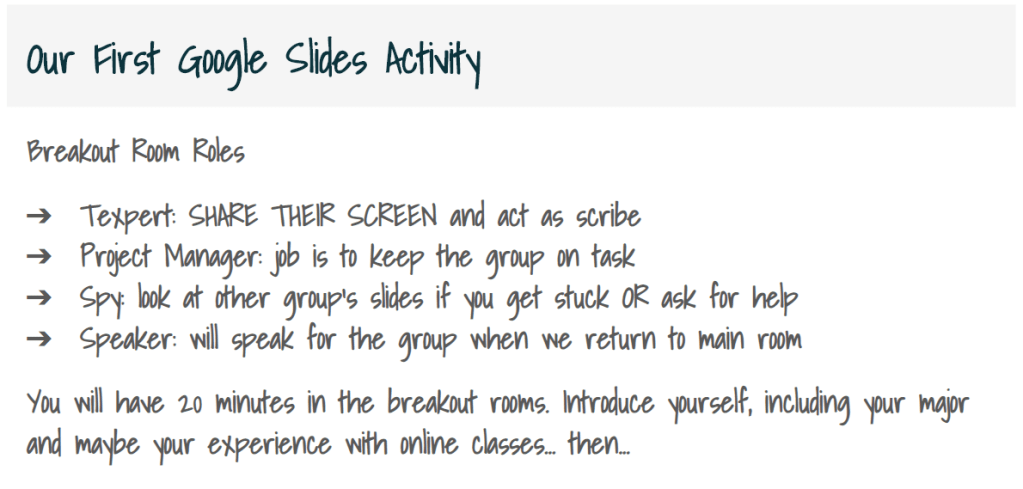
- Emphasize that someone must share their screen in the breakout rooms. I say this at least three times before opening breakout rooms and then broadcast it to all breakout rooms a few minutes in.
- Aim for twenty minutes as the sweet spot in terms of length.
- Monitor progress on the slides, and use the comments to give quick feedback.
- Join each breakout room to check that all members are contributing.
- Make your instructions the background image, so students don’t accidentally delete the stuff they need.
- Know how to access version history, in case a student deletes a slide or encounters an equally devastating problem.
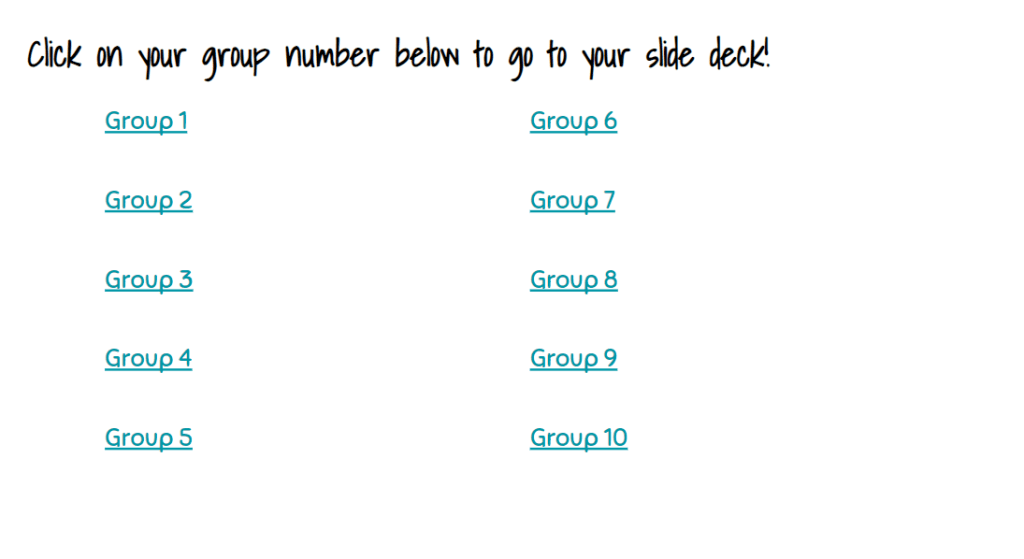
- If you want to run an activity that requires more than one slide per group, use a slide as a landing page (shared as view only) with the edit links to all the group slides:
- If you’re using Canvas, you can create a Google Cloud assignment (see a video here) to assign the slides to students who missed class.
3. Connecting with students
Another key to student success is that students feel a connection to you. That brings us to my third question: How can I ensure that students feel connected to me?
For me, it’s about sharing things I’m interested in. I tried a “liquid syllabus” (see here) this semester rather than my traditional welcome letter, but they both contain the same information that is missing from a traditional syllabus:
- A section about me and my extracurricular interests – which I try to keep varied so that each student might see some small thing we have in common.
- My teaching philosophy.
- What a typical week looks like in our course.
I also respond to each student’s introduction in my asynchronous classes. On our first quiz of the semester, I ask all of my students to ask one question about the course, statistics, or myself and tell me something about themselves. I make sure to respond to each and every one. Yes, my first week of classes is a challenge, but I find that connection pays off later. And it never hurts to interject something you’re passionate about into your lectures and examples – much like Allan, most of my examples are about cats (see blog post #16, Questions about cats, here), and my Canvas pages are adorned with cats too.
4. Creating a safe place for mistakes
If you creep on my welcome site for students, you would see this section: “My course is built on the idea that we aren’t perfect the first time we do something and those mistakes are how we improve and learn. Every assignment (with the exception of exams) can be redone after you receive some guidance from me on how to improve it. There are multiple ways for you to demonstrate your understanding – discussions, projects, exams, creative assignments… If you’ve struggled in a traditional classroom, I hope we’ll find a way to get through this together.” This brings me to my next question: How am I demonstrating to students the value in making mistakes?
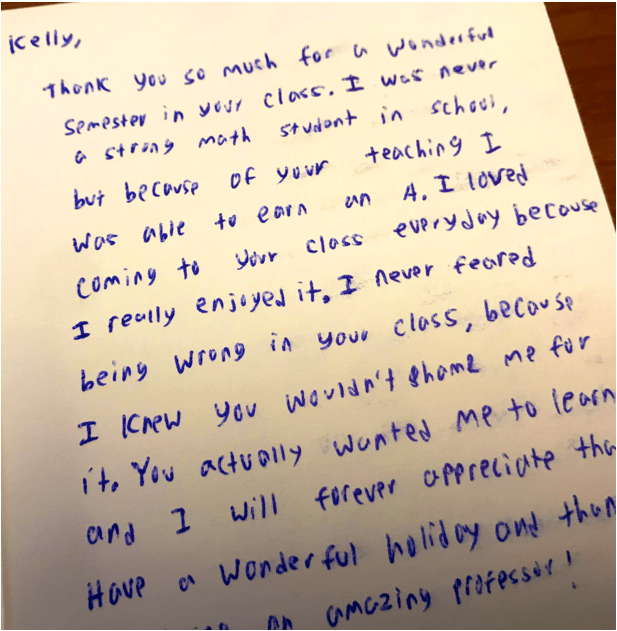
I don’t know about you, but I have countless students who are frozen into inaction by their fear of failure. Students that I know understood the material will turn in tests with blank pages. When I ask them about it, they profess that they just weren’t sure they were on the right track. I try to demonstrate how useful mistakes are with my policies (see above), as well as in how I highlight student work and respond to students. I try to bring up “good mistakes” in class or in video debriefs, focusing on the thinking that led the student to that answer and all the understanding that their work shows. I hope that by applauding those efforts and working hard to build those connections with and between students, they will be more willing to share their thinking without fear.*
* This letter from a former student shows that I’m on the right track, but I need to add a question about this to my end-of-semester survey to make sure all students feel this way.
5. Assessing understanding
Online assessments are a tricky beast. It’s nearly impossible to be sure our students are the ones taking our assessments and that they are doing so without some outside aid. I feel like I have to include this section because it’s the most common question I get from faculty – how can I make sure my students aren’t cheating? Short answer, you can’t. So here’s the question to ask yourself: Are exams the best way to assess student knowledge?
Consider projects or other tasks where students can demonstrate that they understand the course content. Projects have the added bonus of letting students see how statistics is actually used to answer questions, relevant to what they are interested in, and connected to the other courses they are taking. I personally do a variation on the ASA Project Competition (here), where students can either submit a written report or record a presentation.
I still have exams, too. I’ve just lessened their weight so that student don’t have any real incentive to cheat. And I have embraced open-ended questions. For years, I avoided these types of questions because they were harder to grade and truly required students to have a better understanding and communication skills than the same question cleverly written as a multiple choice. On my latest exam, here’s one of the options for a particular question pool:
Many colleges were scrambling to provide resources for students with the switch to remote learning. They surveyed students by reaching out via the students’ listed email addresses to see what resources they would need to continue to attend classes in the switch to online. Do you believe this is a good survey technique? Explain why or why not. What are some issues that may arise from this survey option?
Four years of reading the AP Statistics exam has trained me not to fear reading free response questions like the one above. Even three years ago, I’d probably be shaking in my boots at the prospect of grading over a hundred free response questions on a given exam. I cannot emphasize enough how useful participating in the AP reading has been for me as an educator. Empowered by that experience, my “complete” student response to the question has four components:
- States that the voluntary response method described is not a good technique.
- Notes and provides a reason students may not be included in the survey responses – such as they choose not to take it, don’t check their email, or …
- Notes that students without resources are less likely to respond to the survey.
- Concludes that the schools will underestimate the resources needed as a result of (3).
Much like an AP scoring rubric, students must get component 1 in order to earn any points for the problem. And for full credit, they must include all four components. If you’re looking for some great questions, beyond those that Allan has provided us here over the past year, previous AP Statistics free response questions are a great place to get inspiration as you write assessments and corresponding rubrics*.
* StatsMedic has very helpfully categorized all of these questions by topic here.
6. The Real Question
All of the questions I’ve asked you to reflect on throughout this post come down to a common theme: Am I reaching ALL of my students?
I’m lucky enough to work at a campus that has provided me with data on my classes’ success rates disaggregated by gender, age, and ethnicity. I know what groups I need to work harder to reach. If possible, get these data from your school. If not, have students self report and then see if you notice any trends throughout the semester/year. If you’re new to the idea of culturally responsive teaching, I strongly recommend Zaretta Hammond’s Culturally Responsive Teaching and the Brain – it’s a great mix of research, practical tips, and reflection.
I hope you found something you can use in your classrooms in this post. Take what works for you, leave what doesn’t. And keep continuously reflecting on your own teaching practices.
Here are Allan’s own words (from post #52, Top thirteen topics, here), because I think they bear repeating: “I know that if I ever feel like I’ve got this teaching thing figured out, it will be time for me to retire, both from teaching and from writing this blog.”
This is my mantra*. Keep reflecting on your choices. Keep trying new things. Keep being fearless. Hopefully along the way, we’ll do better for all of our students.
* Minus the blog part, because I have no idea how he did this for 52 weeks!
This guest post has been contributed by Kelly Spoon. You can contact her at kspoon@sdccd.edu.


Trackbacks & Pingbacks