#59 Popularity contest

This guest post has been contributed by Anna Fergusson. You can contact her at a.fergusson@auckland.ac.nz.
Anna Fergusson is a Professional Teaching Fellow in the Department of Statistics at the University of Auckland. I met Anna at the 2019 Joint Statistical Meetings, where she gave a terrific talk about introducing statistics students to data science, which is the topic of her Ph.D. research. I admit that part of the appeal of Anna’s presentation was that her activity involved photos of cats. But more impressive is that Anna described a fascinating activity through which she introduces introductory students to modern computational tools while emphasizing statistical thinking throughout. I am delighted that Anna agreed to write this guest post about her activity, which also highlights her admirable and effective “sneaky” approach to student learning. I also encourage you to follow Anna’s blog, with the not-so-subtle title of Teaching Statistics is Awesome and which has become one of my favourites*, here.
* I am using this non-conventional (for Americans) spelling in appreciation for Anna’s becoming my first guest contributor from outside the U.S.
I am thrilled to write this week’s guest post, not just because I get to add another activity to Allan’s examples of “stats with cats” (see post #16 here), but also because I strongly believe in asking good questions to guide students to discover “new-to-them” ideas or methods.
A current focus for my teaching and research is the design of accessible and engaging learning activities that introduce statistics students to new computational ideas or tools. For these “first exposure” type learning tasks, I use What if..? style questions to encourage curiosity-driven learning. I also use the “changing stuff and seeing what happens” approach for introducing computational concepts, rather than starting the task with formal definitions and examples.
It’s an approach that has been described by both students and teachers as “sneaky,” but I think that it is a pretty good strategy for designing tasks that support the participation of a wide range of students. To pull off this undercover approach, you need a good cover story – something that is engaging, interesting and fun! A really “popular” task I have used to introduce APIs (Application Programming Interfaces) for accessing data involves searching for photos of cats and dogs online. I’ve tried out several versions of this task over the last few years with a range of school-level students and teachers, but this particular version of the task is from the introductory-level university course I’ve designed for students who have not completed Grade 12 mathematics or statistics. The overall question for the exploration is: What is more popular on Pixabay – photos of cats or photos of dogs?
I usually start the activity by asking students: What is your favourite type of animal, cats or dogs? I would like to say that there is a deeper learning point being made here, for example getting students to acknowledge their own personal biases before they attempt to learn from data, but really I ask this question so I can pretend to be offended when more students state that they prefer dogs than cats! And also so I can use this meme:

I then ask students to go to pixabay.com and explore what they can find out about whether photos of cats or dogs are more popular on this website. The only direction I give students is to make sure they have selected “photos” when they search and to point out that the first row of photos are sponsored ones. I encourage students to work in pairs or small groups for this activity.
While finding pretty adorable photos of cats and dogs, students are familiarising themselves with the website and what data might be available for analysis, which will come in handy later in the task. It also helps that popularity metrics such as likes and views are already familiar to students thanks to social media. I generally give students about five minutes to explore and then ask groups to share with the class what they have learned about the popularity of cat and dog photos, including what their “hunch” is about which animal is more popular on Pixabay.
There are a lot of approaches that students can take to explore and compare popularity, and it’s helpful to have some questions up your sleeve to ask each group as they share what they learned. For example, one approach is to determine how many photos are returned when you search for “cat” and compare this to the number of photos that are returned when you search for “dog”. You can ask students who use this approach What happens when you search for “cat” compared to “CAT” compared to “cats”? Students may or may not have noticed that their search terms are being “manipulated” in some way by the website.
Another good question is: Were all the photos returned the kind of “cat” that you expected? This can lead into a discussion about how photos are uploaded and given “tags” by the photographer, and whether the website checks whether the tags are appropriate or correct. Most students discover that if you hover over a photo returned in the search query, you can see some metrics associated with the photo, such as its top three tags and the number of likes, favourites and comments the photo has (see an example below).

To encourage students to think about how the photos are ordered in the search results, I ask students: What photos are being shown to you first when you search for “cat”? Can you spot a pattern to the order of the photos? Initially, students might think that it is just the number of likes (the thumbs-up count) that is determining the order, but if they look across the first 20 or so photos, they should notice that the pattern of decreasing like counts as you move “down the rank” doesn’t always hold.
I also prompt discussion about the nature of the “metrics” by asking: What is another reason why one photo might have more likes than another photo? Clearly, you can’t like a photo if you’ve never viewed it! Additionally, some photos may have been on the website for longer than others and some of these variables require more effort on the part of the “searcher” than others e.g. viewing a photo versus liking a photo.
This phase of the task works well because students are exploring data, generating questions, and integrating statistical and computational thinking, all without any requirements to perform calculations or write precise statistical statements. However, there is only so much you can learn from the website before needing a way to access more of the data faster than viewing each photo individually. Fortunately, Pixabay offers an API service to access photos and data related to the photos (you can find the documentation about the API here).
Don’t know anything about APIs? Don’t worry, neither do my students, and in keeping with my sneaky approach, we’re not going to jump into the API documentation. Instead, I ask students to pay attention to the URL when they search for different photos. I then use a sequence of questions to guide students towards structuring an API request for a particular search:
- What do you notice changes about the URL each time you try a new search?
- Can you change the photos searched for and displayed on the page by changing the URL directly?
- Can you work out how to search for “dog costume” by changing the URL rather than using the search box?
For example, the screenshot below shows that the URL contains fixed information like “photos” and “search” but the last part changes depending on what you search for:
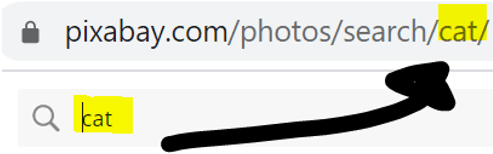
Through this sequence of questions, students start to notice the structure of the URL, and they also learn just a little bit about URL encoding when they try a search based on two words. For example, a search for “cat costume” will result in (1) cute photos of cats, but also (2) a URL where the spaces have been replaced with “%20”: https://pixabay.com/photos/search/cat%20costume/.

I then ask students to find a photo of a cat or a dog that they really like and to click on this photo to open its webpage. I then use a sequence of questions to guide students towards structuring an API request for a particular photo:
- What do you notice about the URL for a specific photo?
- How is it different from the URL when we were searching for photos?
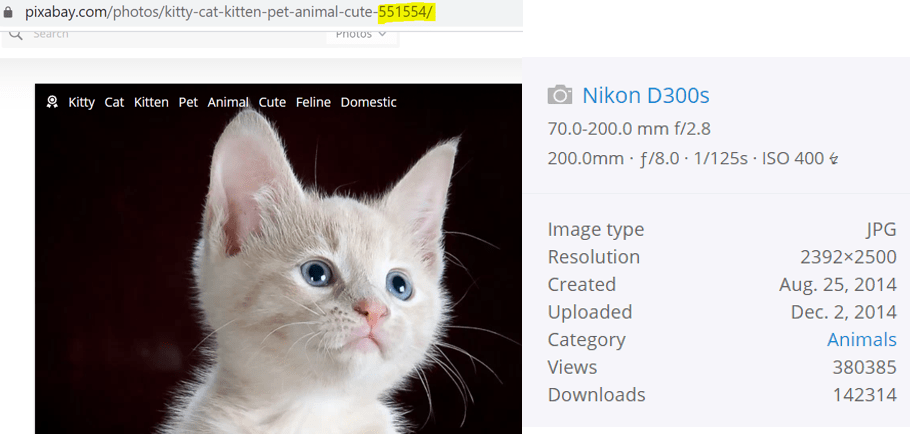
- Which part do you think is the ID for the photo?
- What happens if you delete all the words describing the photo and leave just the ID number, such as: https://pixabay.com/photos/551554?
- Is there a photo that has an ID based on your birth date?
- What was the first photo uploaded to the website?
- How could we randomly select one photo from all the photos on Pixabay?
That last question is a sneaky way to bring in a little bit of discussion about sampling frames, which will be important later in the task if/when we discuss inference.
Once students have played around with changing the URL to change what is displayed on the webpage, I congratulate them on becoming “URL hackers.” Now it’s time to look more closely at what data about the photo is available on its webpage. I typically ask students to write down all the variables they could “measure” about their chosen photo. Depending on time, we can play a quick round of “Variable Boggle,” where each pair of students tries to describe another variable that no other pair has already described before them.
I then tell the students that the Pixabay API is basically a way to grab data about each photo digitally rather than us copying and pasting the data ourselves into a spreadsheet, and that to get data from the API we have to send a request. I then introduce them to an app that I have developed that allows students to: (1) play around with constructing and testing out Pixabay API requests, and (2) obtain samples of photos as datasets.
The app is available here. Clicking on the top left button that says “API explorer” takes you to the screen shown below:
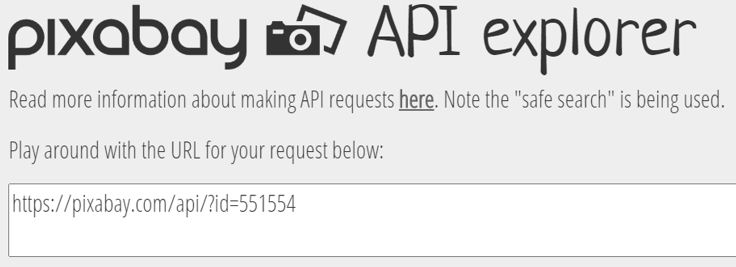
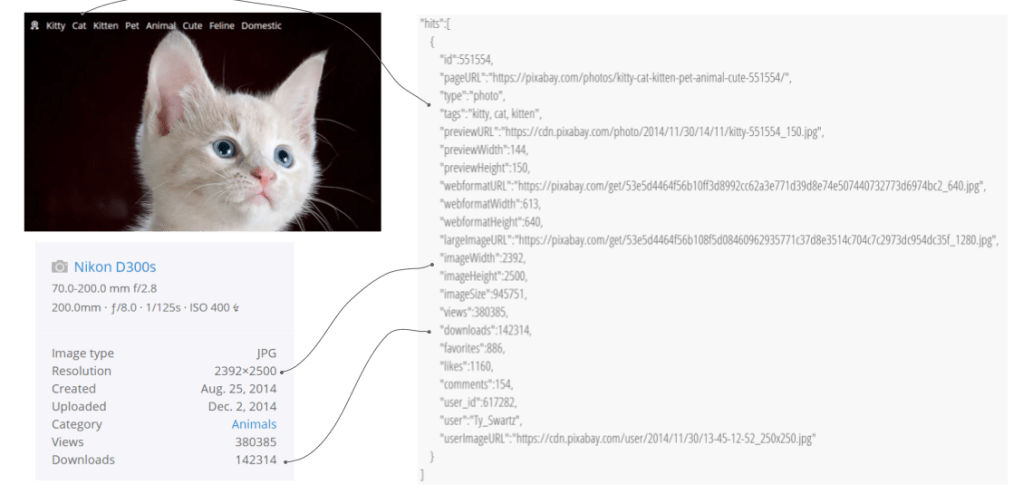
The API explorer is set up to show a request for an individual photo/image, and students only need to change the number to match the id of the photo they have selected. When they send the request, they will get data back about their photo as JSON (JavaScript Object Notation). As students have already recorded the data about their photo earlier in the task, they don’t seem to be intimidated by this new data structure. I then ask students to compare what we could view about the photo on its webpage with the data we can access about each photo from the API, asking: What is the same? What is missing? What is new?
For example, a comparison of the information available for a photo on the webpage and the JSON returned for an individual photo reveals that only the first three tags about a photo are provided by the API, that the date the photo was created is not provided, and that a new variable called imageSize is provided by the API:
Reminding them of earlier discussion about how long a photo has been online for, I point out that the date the image was uploaded is not directly available from the API (if students have not already identified this is missing when sharing the similarities and differences between data on the webpage and data from the API). I ask them: Is there another variable about the photo that we could use to estimate how long the photo has been online? Do any of these variables appear to contain date information? Once we’ve narrowed it down to two potential candidates – previewURL and userImageURL – I ask students to compare the dates shown in the URL to the date uploaded on the webpage for the photo. This mini-exploration leads to a discussion that we could use the date from the previewURL to estimate the date the photo was uploaded, and that while the dates don’t always match up, the date from previewURL appears to be a reasonable proxy.
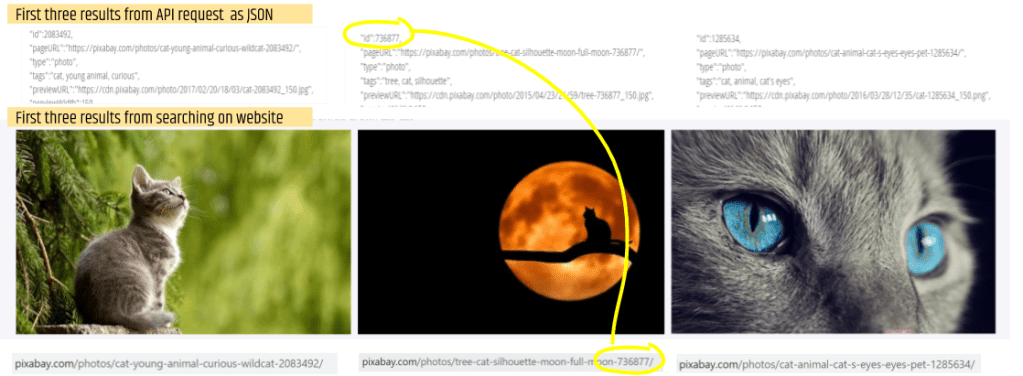
One of the limitations of the Pixabay API is that you only get a maximum of 500 results for any request. You do have a choice of ordering the results in terms of popularity or date uploaded, and for my app I have chosen to return the results in terms of popularity (hence the title of the activity!). To help students discover this and also a little more about how JSON is structured, we can use the API explorer to search photos based on a keyword. To connect back to our initial search for “cat” or “dog”, I tell students they can change the API request from “id=” to “q=” to search for photos based on a key word or words. I ask them to use the API explorer to search for photos of cats, and to compare the first three results from their API request (q=cat) to the first three results from searching for “cat” on the Pixabay website (see screenshots below).
Now that we’ve learned a little how we can use the Pixabay API to access data about photos, it’s time to refocus on our overall question: What is more popular on Pixabay – photos of cats or photos of dogs? To do this, we’ll use another feature of the app that allows students to obtain random samples of the most popular photos. I direct students to use the app to take a random sample of 100 cats and 100 dogs from the most popular photos on Pixabay, and the app then displays all the photos in the sample on the left side of the screen:
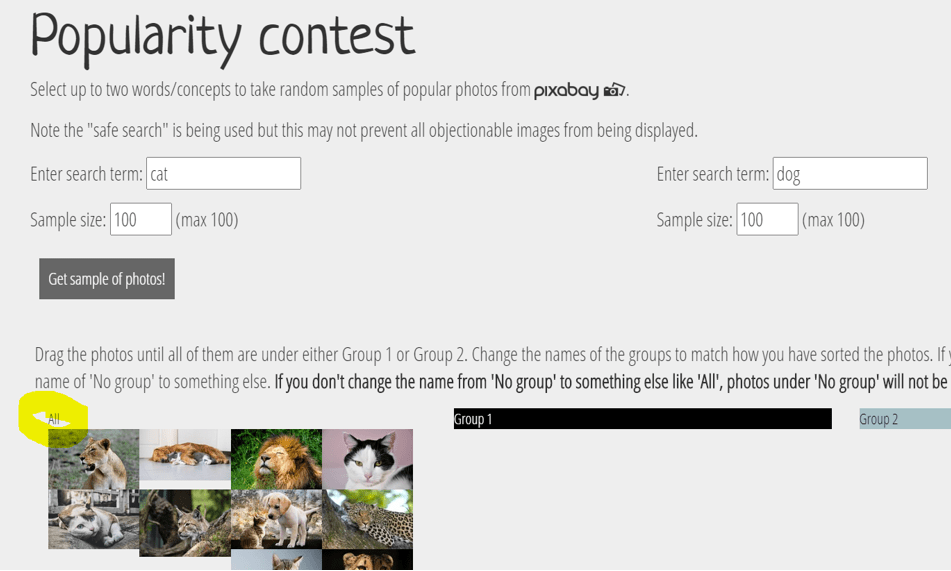
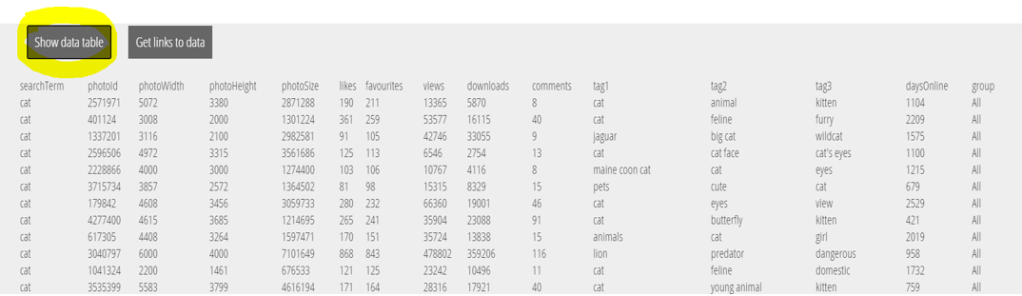
The interface is designed to allow for a new categorical variable to be created, based on dragging the photos across the page in two groups (see later for examples of explorations of this nature). For this exploration, we don’t need a new categorical variable because we searched for photos of dogs and cats, and the search term used is one of the variables. To use all the photos under “No group” students need to re-label the “No group” heading to something else like “All.” Clicking the “Show data table” button allows students to see the data about each photo as a rectangular data structure (each row is a different photo):
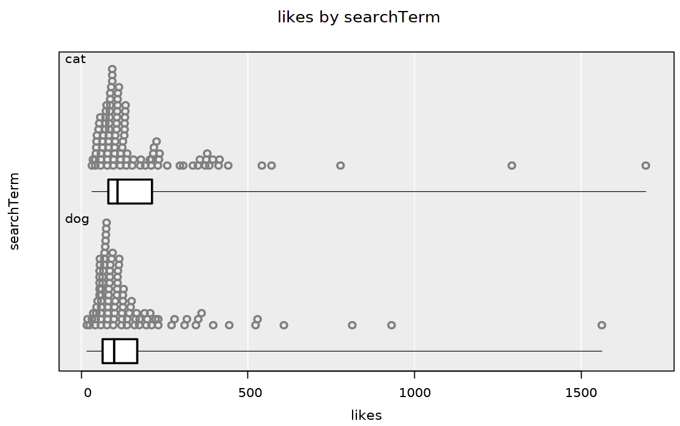
Clicking the “Get links to data” button allows students a quick way to “jump with the data” into an online tool for exploring the data, as well as the option to download the data as a CSV file. I use this task with students after they have already used a tool like iNZight lite (here) to explore data. This means I can just ask my students to use the data to check their hunch about whether photos of cats or dogs are more popular on Pixabay, and give them time to explore their data with their partner/group. Similar to earlier in the task, after about 10 minutes I ask the different pairs/groups of students to share what they have learned. Most groups make plots comparing likes by the search term, as shown here:
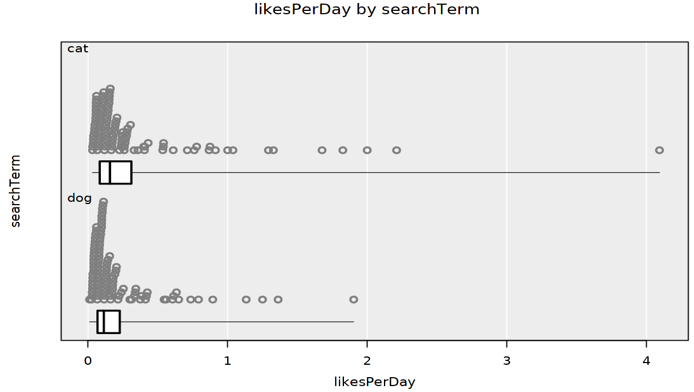
Some students create a new variable, for example the number of likes per days online, and compare this for the cat and dog photos in the sample, as below:
Depending on where the class is at in terms of learning about sample-to-population inference, we can talk about more formal approaches for comparing the popularity of cat and dog photos on Pixabay. An important aspect to that discussion is that the population is not all photos on Pixabay, but the most popular photos as determined by Pixabay using some sort of algorithm unknown to us.
The activity ends with asking students to carry out their own exploration to compare the popularity of two types of photos on Pixabay. The huge advantage we have with introducing an API as a source of data to students, and providing an app that allows easy access to that API, is that students get to choose what they want to explore. By using an API connected to a photo-sharing website with search capabilities, students also have a way of building familiarity with the data before accessing the data set. Beyond comparisons of popularity, other interesting investigations involve using what is shown in the photo to create a new categorical variable. For example, I’ve had students explore whether most photos of dogs are outside shots (see earlier discussion and screenshot of creating new categorical variables using the popularity contest app). Other interesting research questions from students have included: Are most of the popular Pixabay photos tagged as “cat,” photos of domestic cats?
Often my students form their ‘hunch” for a research question based on viewing the first 20 or so photos from the website search. Then they are surprised not to find a similar result when taking a random sample of popular photos. I think there’s something nice in this idea of not jumping to conclusions from searches generated by an algorithm designed to give prominence to some photos over others! My students have also written about how the task helps expand their ideas of where they can get data from and makes them more aware of how much data is being collected from them as they interact with websites.
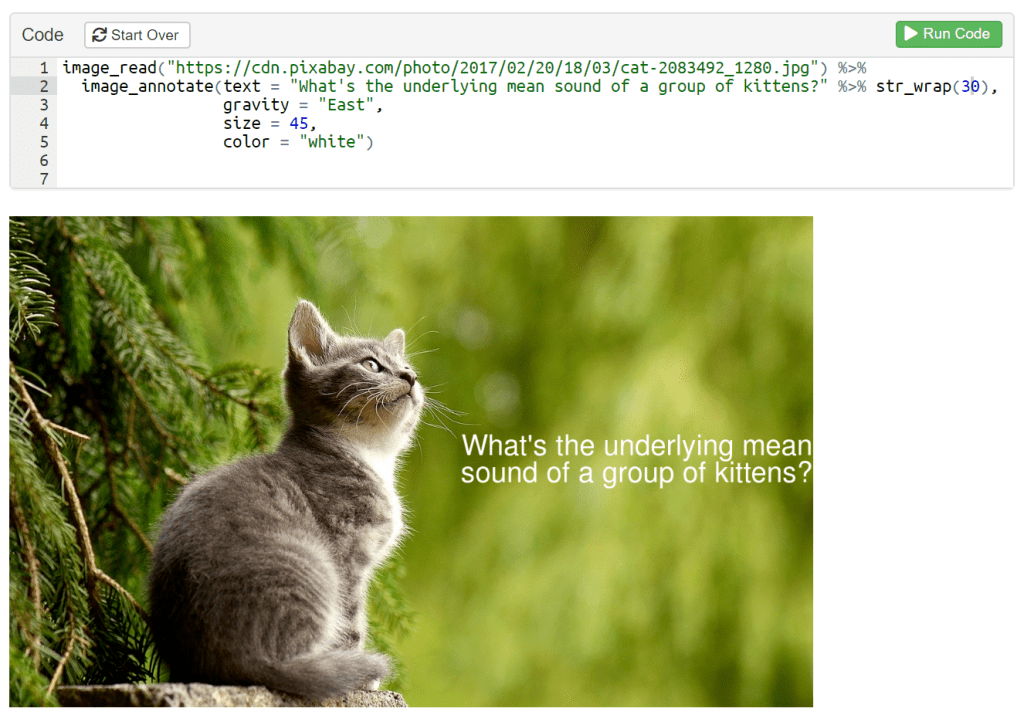
I commented at the beginning of this post that tasks like these have been described by others as “sneaky.” I’ve also been accused of tricking students into learning because I made the activities so much fun. In fact, my students’ enjoyment continues even when I extend this task to introduce them to using R code to interact with Pixabay photos and the API. I say “even” because so many of my students have pre-determined negative views about learning computer programming, so they really are genuinely surprised to find that the experience of “coding with data” can be fun. Especially if you use a “cover story” of creating memes, using Pixabay photos as a sneaky way to learn about arguments for functions!
When we design activities that introduce students to new computational ideas or tools, it’s only natural to make the “new thing” the star of the show. Although the overall learning goal of this task is to introduce students to some new ideas related to APIs, the immersive experience of searching for photos to find out whether cats are more popular than dogs is the real star of every act of this show. By structuring and asking good questions to drive learning rather than focusing on formal definitions initially, I believe a wide range of students are supported to engage with the many statistical and computational ideas that they discover along the way. What else makes this task successfully sneaky? Cats, of course, lots and lots of photos of cats!

This guest post has been contributed by Anna Fergusson. You can contact her at a.fergusson@auckland.ac.nz.

