#66 First step of grading exams

I gave my first exam of the term, my first online exam ever, this past Friday. As I sat down to grade my students’ responses for the first time in almost sixteen months, I realized that I had almost forgotten the crucial first step of grading exams: Procrastinate!
I have bemoaned the fact that I have so much less time available to concentrate on this blog now that I have returned to full-time teaching, as compared to last year while I was on leave. So, what better way to procrastinate from my grading task than by engaging in the much more enjoyable activity of writing a blog post?
What should I write about? That’s easy: I will tell you a bit about the exam whose grading I am neglecting at this very moment.
Students took this exam through Canvas, our learning management system*. This is a first for me, as my students in previous years took exams with paper and pencil. I included a mix of questions that were auto-graded (multiple choice and numerical answer) and free-response questions that I will grade after I finish the all-important first step of procrastinating. Roughly two-thirds of the points on the exam were auto-graded. I wrote several different versions of many questions in an effort to discourage cheating. Students had 90 minutes to complete the exam, and they were welcome to select any continuous 90-minute period of time between 7am and 7pm. Students were allowed to use their notes. Topics tested on the exam including basic ideas of designing studies and descriptive statistics.
* In post #63 (My first video, here), I referred to Canvas as a course management system. Since then I realized that I was using an antiquated term, and I have been looking for an opportunity to show that I know the preferred term is now learning management system.
Some of the questions that I asked on this exam appear below (in italics):
1. Suppose that the observational units in a study are the national parks of the United States. For each of the following, indicate whether it is a categorical variable, a numerical variable, or not a variable.
- the area (in square miles) of the national park
- whether or not the national park is in California
- the number of national parks that are to the east of the Mississippi River
- whether there are more national parks to the east of the Mississippi River than to the west of the Mississippi River
- the number of people who visited the national park in September of 2020
I give my students lots of practice with this kind of question (see post #11, Repeat after me, here), but some continue to struggle with this. Especially challenging is noticing the ones that are not variables for these observational units (parts c and d). Each student saw one of four variations on this question. The observational units in the different version were patients who visited the emergency room at the local hospital last week, the commercial flights that left the San Luis Obispo airport last month, and customers at a local In-n-Out fast food restaurant on a particular day. I posed this as a “matching” question in Canvas, where each of the five parts had the same three options available.
2. Suppose that the ten players on basketball team A have an average height of 76 inches, and the ten players on basketball team B have an average height of 80 inches. Now suppose that one player leaves team A to join team B, and one player leaves team B to join team A. How would the average heights of the two teams change? The options that I presented were: No change, Both averages would increase, Both averages would decrease, The average would increase for A and decrease for B, The average would decrease for A and increase for B, It is impossible to say without more information.
The correct option is the last one: It is impossible to say without more information. My goal here was for students to understand that players’ heights vary on both teams, so we cannot state any conclusions about how the averages would change without knowing more about the heights of the individual players who changed teams.
3. San Diego State’s admission rate for Fall 2019 was 34.13%, compared to 28.42% for Cal Poly – SLO’s. Determine the percentage difference between these admission rates. In other words, San Diego State’s admission rate was higher than Cal Poly – SLO’s by ___ %. Enter your answer as a number, with two decimal places of accuracy. Do not enter the % symbol.
As I mentioned throughout post #28 (A pervasive pet peeve, here), I emphasize how a difference in proportions is not equivalent to a percentage difference. This question assessed whether students took my emphasis to heart. Each student answered one of four versions of this question, with different campuses being compared. I obtained the data on admission rates from the dashboard here.
4. A series of questions referred to the following graph from a recent Gallup study (here):
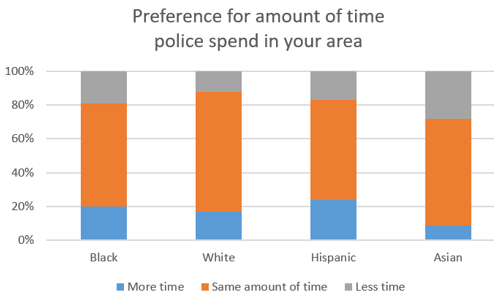
The most challenging question in this series was a very basic one: How many variables are represented in this graph? The correct answer is 2, race and preference for how much time police spend in the area. The other options that I presented were 1, 3, 4, and 12.
5. Another series of questions was based on this study (available here): Researchers surveyed 120 students at Saint Lawrence University, a liberal arts college with about 2500 students in upstate New York. They asked students whether or not they have ever pulled an all-nighter (stayed up all night studying). Researchers found that students who claimed to have never pulled an all-nighter had an average GPA (grade point average) of 3.1, compared to 2.9 for students who claimed to have pulled an all-nighter. Some basic questions included identifying the type of study, explanatory variable, and response variable. These led to a question about whether a cause-and-effect conclusion can legitimately be drawn from this study, with a follow-up free-response question* asking students to explain why or why not.
* Oh dear, I just reminded myself of the grading that I still need to do. This procrastination step is fun but not entirely guilt-free.
Some other free-response questions waiting for me to grade asked students to:
6. Create a hypothetical example in which IQR = 0 and the mean is greater than the median. I think this kind of question works well on an online exam. Different students should give different responses, so I hope this question encourages independent thinking and discourages cheating. (See post #31, Create your own example, part 1, here, for many more questions of this type.)
7. Write a paragraph comparing and contrasting the distribution of money winnings in 2019 on three professional golf tours – men’s, women’s, and senior men’s, as displayed in the boxplots:
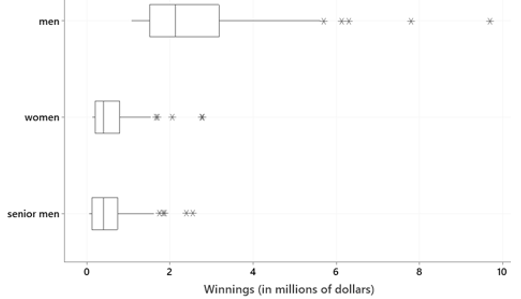
I am looking for students to compare center, variability, and shape across the three distributions. They should also comment on outliers and relate their comments to the context.
8. Describe and explain the oddity concerning which hospital performed better, in terms of patients experiencing a complete recovery, for the data shown in the following tables of counts:
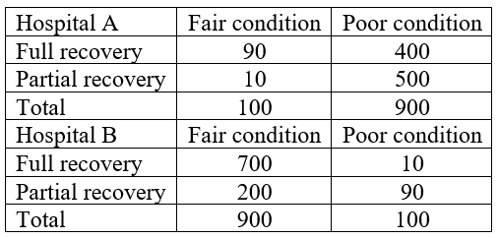
I expect this to be one of the more challenging questions on the exam. Students need to calculate correct proportions, comment on the oddity that Hospital A does worse overall despite doing better for each condition, and explain that Hospital A sees most of the patients in poor condition, who are less likely to experience a full recovery than those in fair condition.
Writing my exam questions in Canvas, and preparing several versions for many questions, took considerably more time than my exam writing in the past. But of course Canvas has already saved me some time by auto-grading many of the questions. I should also be pleased that Canvas will also add up students’ scores for me, but I always enjoyed that aspect of grading, largely because it was the last part and provided a sense of completion and accomplishment.
Hmm, I probably should not be imagining an upcoming sense of completion and accomplishment while I am still happily immersed in the procrastination step of the exam-grading process. I must grudgingly accept that it’s time for me to proceed to step two. If only I could remember what the second step is …


I really enjoyed this post, seeing the questions on your exam and also what you expect students to include in a correct answer. I am also teaching statistics and giving exams online for the second time (switched to online in March, as most others did). I also create multiple versions of each question because I think it is the best way to avoid cheating, and allow my students to take the timed test over a 12 hour period as you did. I love that exams no longer take away from class time, since I have so few hours in class to start with. I think I will continue the practice even when we are back in the classroom. I use a different online homework/test platform than Canvas, but I love that some questions will will be graded for me. Slogging through all those paper exams was a nightmare. Thank you for always giving me something to think about, I love your blog posts. Judy – San Diego Miramar College
LikeLike