#71 An SBI quiz
During this past week, I introduced my students to simulation-based inference (SBI), as described in post #12, here. I gave a follow-up quiz in our learning management system Canvas to assess how well they could apply what they learned to a study that they had not yet seen. I give three of these application quizzes in a typical week, along with three quizzes that assess how well they followed the handout that we worked through*. All of these quizzes consist of five questions that are auto-graded in Canvas. I regard these quizzes as formative rather than summative, and I encourage students to help each other on the quizzes.
* Students could work through the handouts completely on their own, but most students either attend a live zoom session, during which I lead them through the handout, or watch videos that I prepare for each handout**.
** For those of you who read about my ludicrous, comedy-of-errors experience with recording my first video (post #63, here), I am happy to report that I have recorded 83 more videos for my students since then. Not many have gone smoothly, but all have gone much more smoothly than my first feeble attempts.
Writing auto-graded quizzes is a new experience for me. For this blog post, I will present my auto-graded SBI quiz questions, describe my thinking behind each question, and discuss common student errors. I will also discuss some questions that I did not ask, and I may very well second-guess some of my choices. The quiz questions appear below in italics.
For the context in this quiz, I use a study that I described in an exam question presented in post #22, here.
Researchers presented young children (aged 5 to 8 years) with a choice between two toy characters who were offering stickers. One character was described as mean, and the other was described as nice. The mean character offered two stickers, and the nice character offered one sticker. Researchers wanted to investigate whether children would tend to select the nice character over the mean character, despite receiving fewer stickers. They found that 16 of the 20 children in the study selected the nice character.
1. What values would you enter for the inputs of a coin-tossing simulation analysis of this study?
- Probability of heads
- Number of tosses
- Number of repetitions
I used the matching format in Canvas for this question. The options presented for each of the three sub-parts were: 0.5, 0.8, 1, 10, 16, 20, and 10,000. The correct answers are 0.5, 20, and 10,000, respectively.
As the sample proportion of children who selected the nice character, the value 0.8 makes a good option for the probability of heads. Some students believe that the simulation is conducted with the sample value rather than the null-hypothesized value. I chose the value 16 as a good distractor for the number of tosses, because it is the number of children in the sample who selected the nice character. I threw in the values 1 and 10 for good measure.
2. Consider the following graph of simulation results:
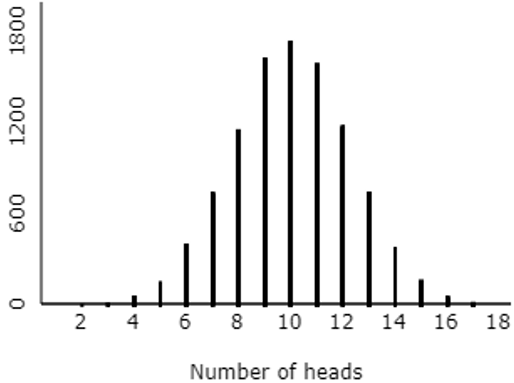
Based on this graph, which of the following is closest to the p-value?
The options presented were: 0.005, 0.100, 0.500, 0.800. I had to keep these options pretty far apart, because we cannot determine the p-value very precisely from the graph.
Students are to realize that the p-value is approximated by determining the proportion of repetitions that produced 16 or more heads. Although we cannot approximate the p-value very accurately from this graph, we can see that obtaining 16 or more heads did not happen very often. The closest option is 0.005.
I considered asking students to use an applet (here) to conduct a simulation analysis for themselves and report the approximate p-value. But I wanted this question to focus on whether they could read a graph of simulation results correctly.
I also thought about asking students to indicate how to determine an approximate p-value from the graph of simulation results. The correct answer would have been: count the number of repetitions that produce 16 or more heads, and then divide by the number of repetitions. Some obvious incorrect options could have been to count the repetitions that produced 10 or more heads, or to count the number of repetitions that produced exactly 10 heads. Perhaps that would have been better than the version I asked. I am a bit concerned that some students might have answered my question correctly simply be selecting the smallest option presented for the p-value. On the other hand, one of the two examples presented in the handout led to a large p-value close to 0.5, so I hope my students do not necessarily think that the smallest p-value will always be the correct answer.
3. Based on this simulation analysis, do the data from this study provide strong evidence that children have a genuine preference for the nice character with one sticker rather than the mean character with two stickers? Why?
The options presented were:
- Yes, because it is very unusual to obtain 16 or more heads
- Yes, because the distribution follows a bell-shaped curve
- Yes, because the distribution is centered around 10
- No, because it is very unusual to obtain 16 or more heads
- No, because the distribution follows a bell-shaped curve
- No, because the distribution is centered around 10
I like this one. This question directly addresses the reasoning process of simulation-based inference. The correct answer is the first one listed here. I think the distractors are fairly tempting, because some students focus on the shape or center of the distribution, rather than thinking about where the observed result falls in the distribution. Those misconceptions are common and important to address.
You could fault me, I suppose, for not adding if the children actually had no preference after it is very unusual to obtain 16 or more heads to the end of the correct answer. But I think omitting that from all of the options kept the question reasonable. In hindsight perhaps I should have written the correct answer as: Yes, because the simulation rarely produced 16 or more heads.
4. The following graph pertains to the same simulation results, this time displaying the distribution of the proportion of heads:
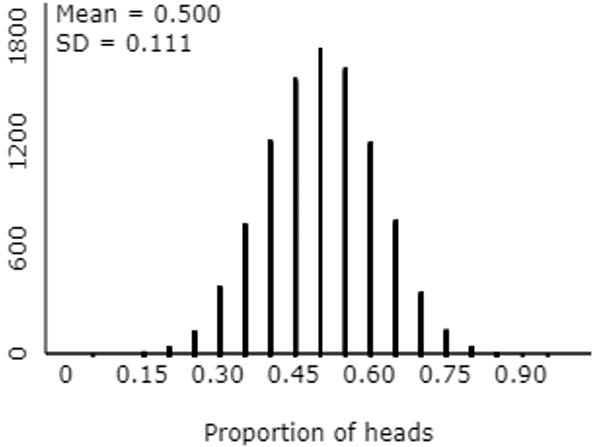
Calculate the z-score for the sample proportion of children in the study who selected the nice character with one sticker. Report your answer with one decimal place of accuracy.
This question calls for a numerical answer rather than multiple-choice. The correct answer is: z = (.800 – .500) / .111 ≈ 2.7*. I allowed an error tolerance of 0.05 for the auto-grading process, so as not to penalize students who ignored my direction to use one decimal place of accuracy in their answer.
* My students have not yet studied the general expression for the standard deviation of the sampling distribution of a sample proportion, so their only option is to use the standard deviation of the 10,000 simulated sample proportions, as report in the output.
This z-score calculation is not directly related to simulation-based inference, I suppose. But I think z-scores are worth emphasizing*, and this also foreshadows the one-proportion z-test to come.
* See post #8, End of the alphabet, here.
5. Suppose that the study had found that 13 of 20 children selected the nice character with one sticker. How would the p-value have changed, as compared to the actual result that 16 of 20 children selected that character?
The options presented here were: larger, smaller, no change. The correct answer is larger*, because the p-value would entail repetitions that produced 13 or more heads, which will certainly be more than those that produced 16 or more heads.
* You may have noticed that I have always presented the correct answer first in this post, but Canvas shuffled the options for my students, so different students saw different orderings.
I considered asking how the strength of evidence would change, rather than how the p-value would change. It’s certainly possible for a student to answer the p-value question correctly, without making the connection to strength of evidence. But it’s also possible that a student could correctly answer about strength of evidence without thinking through what that means for the p-value. In hindsight, I wish that I had asked both versions in one question, like this:
Suppose that the study had found that 13 of 20 children selected the nice character with one sticker. How would the p-value have changed, as compared to the actual result that 16 of 20 children selected that character, and how would the strength of evidence that children genuinely prefer the nice character have changed? [Options: larger p-value, stronger evidence; larger p-value, weaker evidence; smaller p-value, stronger evidence; smaller p-value, weaker evidence]
As I mentioned earlier, I confine myself to asking five questions on every quiz. I like this consistency, and I hope students appreciate that too. But I feel no such constraint with blog posts, so now I will present five other questions that I could have asked on this quiz, all based on the same study about children selecting toy characters.
6. What are the observational units and variable in this study? I ask these questions very often in class*, and I also ask them fairly often on assessments. This might have worked well in matching format, with options such as: children, toy characters, which character a child selected, number of children who selected nice character, proportion of children who selected nice character.
* See post #11, Repeat after me, here.
7. Which of the following describes the null model/hypothesis? Options could have included:
- that children have no genuine preference between these two characters,
- that infants genuinely prefer the nice character with one sticker to the mean character with two stickers,
- that 80% of all infants prefer the nice character with one sticker.
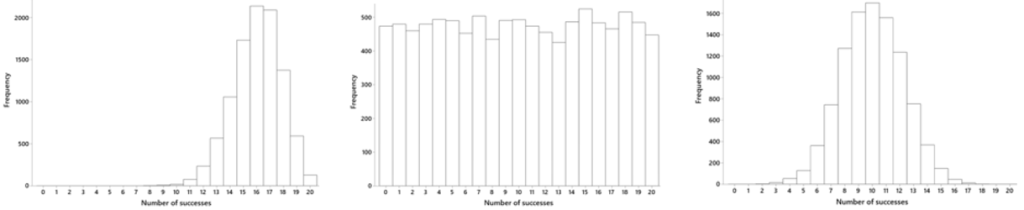
8. Which of the following graphs is based on a correct simulation analysis?
9. What does the p-value represent in this study? Options could have included:
- the probability that 16 or more children would have selected the nice character, if in fact children have no genuine preference between the two characters
- the probability that 10 children would have selected the nice character, if in fact children have no genuine preference between the two characters
- the probability that 10 children would have selected the nice character, if in fact children have a genuine preference for the nice character
- the probability that children have no genuine preference between the two characters
10. How would the p-value change if the study had involved twice as many children, and the same proportion had selected the nice character with one sticker? The options would be: smaller, larger, no change. Students would have needed to use the applet on this question, or else relied on their intuition, because we had not yet investigated the effect of sample size on p-value or strength of evidence.
The correct answers for these additional questions are: 6. children, which character a child selected; 7. no genuine preference; 8. the graph on the right, centered at 10 with a normal-ish shape; 9. the first option presented here; 10. smaller.
Confining myself to auto-graded questions on quizzes* is a new experience that requires considerable re-thinking of my assessment questions and strategies. In this post I have given an example of one such quiz, on the topic of simulation-based inference. I have also tried to provide some insights into my thought process behind these questions and the various answer options for multiple-choice ones. I have also indicated some places where I think in hindsight that I could have asked better questions.
* Not all aspects of my students’ work are auto-graded. I assign occasional investigation assignments, like the batch testing investigation that I wrote about in my previous blog post here, for which I provide a detailed rubric to a student grader. On exams, I use a mix of auto-graded and open-ended questions that I grade myself, as I discussed in this post #66, First step of grading exams, here.
P.S. The study about children’s toy character selections can be found here.


Thhis was great to read
LikeLike