#25 Group quizzes, part 1
I tell my students in my syllabi that they will take lots of quizzes in my course. That raises an obvious question: How many is lots? Let’s look at some data. This graph shows the distribution of number of quizzes that I have given in 25 courses over the past several years:
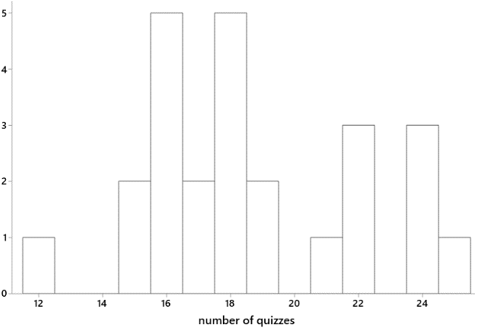
The median is 18 and mean is 18.72 quizzes per course. My courses meet for ten weeks (on the quarter system), so my students take an average of slightly fewer than 2 quizzes per week. Many of my courses meet twice per week for 110 minutes per class meeting, so this amounts to about one quiz per class meeting.
Why do I give so many quizzes? I tell students in my syllabi that the quizzes provide them with opportunities to:
- improve their understanding of the material
- assess how well they understand the material
- prepare for the kinds of questions that will be on exams
With few exceptions these are group quizzes. Even though I encourage students to work together and help each other as we work through in-class activities, I find that they engage much more concertedly during these group quizzes. Apparently the precious commodity of points toward their course grade provides a strong motivation. Conversations that I overhear as students work on group quizzes convince me that they are truly helping each other to learn at these times.
Students usually form groups by self-selection. Sometimes I mix things up by randomly assigning students to groups for a given quiz. I typically limit group sizes to three students, but I allow them to form groups of any size for one quiz near the end of the course. I emphasize that by putting their name on a quiz, they are attesting that they made a good-faith effort to help the group with the quiz. Once in a while students abuse this rule by including the name of a classmate who was not even in class that day, but I don’t think this occurs too much.
These quizzes typically ask about topics that students are to have learned in class that day. Students are almost always allowed to use their notes during the quiz. This policy encourages them to take good notes during class and also alleviates some of the stress of taking a quiz. Once in a while, when I run out of class time, I’ll ask students to complete a quiz outside of class, but students are much less likely to work together on take-home quizzes.
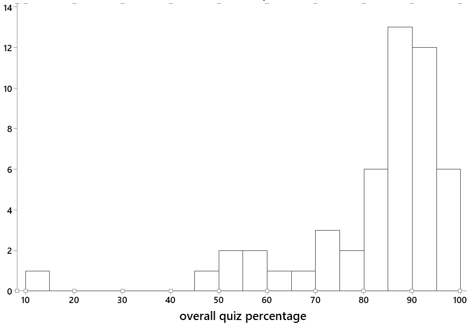
Every quiz consists of five parts, each worth one point. The lowest two (sometimes three) quiz scores in the course are dropped before the calculation of each student’s overall quiz percentage. The quizzes usually contribute only 10% to the calculation of the overall course score. I tell students on the first day of class that most students’ overall course score is helped by their quiz percentage. The distribution of overall quiz percentages from one of my recent courses, shown in the graph below, is quite typical. The distribution is sharply skewed to the left, largely due to some students who miss more than a few quizzes, with a median of 87.35 percent and mean of 81.89 percent:
The remainder of this blog post, and all of the next one, consists of quizzes that I have given in introductory statistics courses, along with comments on each. I will present thirteen quizzes, six in this post and seven to come next week. The order of topics will reveal that I introduce simulation-based inference for a proportion early in the course.
1. For parts (a) and (b), consider the research question of whether students at Cal Poly – San Luis Obispo are more likely to wear clothing that says “Cal Poly” than students at Cal Poly – Pomona. Suppose that you were to collect data for a statistical study of this question.
- a) Identify the explanatory variable, and classify it as numerical or categorical.
- b) Identify the response variable, and classify it as numerical or categorical.
For parts (c) – (e), consider the patients who went to the emergency room at the local hospital last week as the observational units in a statistical study.
- c) Identify one categorical variable that could be recorded on these observational units.
- d) Identify one numerical variable that could be recorded on these observational units.
- e) State a research question that you could investigate about these observational units, using at least one of the variables that you gave in part (c) or (d).
As I said in post #11 (here), I ask students about observational units and variables in nearly every example that we discuss in the entire course. Not surprisingly, an early quiz focuses on this topic. Most students do fine with parts (a) and (b), although some express the response variable poorly by saying something like “wearing Cal Poly clothing” instead of “whether or not the student wears Cal Poly clothing.” Parts (c)-(e) are more challenging, as they ask students to think of their own variables. Part (e) is especially difficult; I have found that it’s much easier for students to describe variables than to state a research question to be investigated with those variables. A good answer to part (e) does not need to be complicated. For example, a fine answer is: “How long is the average waiting time to see a medical professional after arriving at the emergency room?”
2. Recall that you took samples of words from the population of words in the Gettysburg Address, for which the average length of a word is 4.295 letters. Parts (a)-(d) refer to this situation.
- a) Is the number 4.295 a parameter or a statistic?
- b) When you first selected your sample of 10 (circled) words, what was the variable? Was it categorical or numerical?
- c) What aspect of the first graph on the board indicated that the sampling method was biased?
- d) Would selecting words by closing your eyes and pointing at the page 10 times produce an unbiased sampling method? Explain briefly.
- e) In general, does taking a very large sample (say, of millions of people) produce an unbiased sampling method? Explain briefly.
Based on the Gettysburg Address activity that I described in post #19 (here), this quiz assesses whether students have understood the activity that they worked through in class that day. They can answer parts (a)-(d) directly from their notes, so this quiz should provide easy points for students. Part (e) requires students to stop and think a bit. I hope they’ll remember our class discussion of the infamous Literary Digest poll from 1936, which illustrates that a very large sample size does not guarantee an unbiased sampling method. I don’t often give quizzes that are this straight-forward and can be answered with little new thinking, but I believe this makes for a nice change-of-pace. I also think it’s okay now and then for a quiz to reward students for being in class and paying attention.
3. Researchers investigated whether they could correctly predict the outcome of an election, more often than not, by selecting the candidate whose face is judged (by a majority of people interviewed) to be more competent-looking. They applied this prediction method to 32 U.S. Senate races in 2004. The “competent face” method correctly predicted the winner in 23 of the 32 races.
- a) What are the observational units in this study, and what is the sample size?
- b) Describe (in words) the null hypothesis to be tested.
Consider the following results of a simulation analysis with 10,000 repetitions, for testing whether the competent face method would correctly predict the winner in more than half of all races:
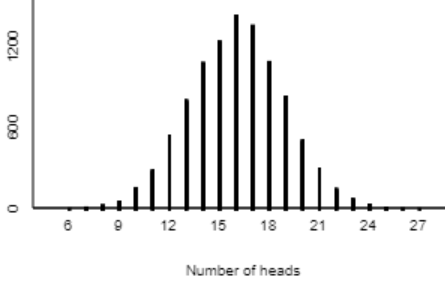
- c) Describe how you would use the simulation results to approximate the p-value of the test.
- d) The p-value turns out to be approximately 0.01. Write a sentence interpreting this p-value in context (probability of what, assuming what?).
- e) Do the sample data provide strong evidence in support of the “competent face” prediction method? Justify your answer, based on the simulation analysis.
This quiz assesses students’ understanding of simulation-based inference as presented early in the course. Students would have seen an example such as the one presented in post #12 (here) before taking this quiz.
The second question in part (a) is meant to help students answer the first question. If they realize that the sample size is 32, they can stop and ask themselves: 32 of what? This should lead them to recognize that the 32 Senate races are the observational units, not the people who were interviewed to determine which candidate’s face is judged to be more competent.
Part (c) requires students to specify how they would use the applet to determine the approximate p-value, without needing to give them access to the applet.
Notice that part (d) gives a big hint about the two things (in addition to context) that students should include in their interpretation of a p-value: probability of obtaining 23 or more correct predictions in 32 races, assuming that the competent-face method would be correct for 50% of all races in the long run. I do not give these hints later in the course, when I expect students to have a firmer grasp of interpreting a p-value, but I think such a hint is appropriate and helpful early on.
4. Suppose that a tire manufacturer believes that the lifetimes of its tires follow a normal distribution with mean 50,000 miles and standard deviation 5,000 miles.
- a) Based on the empirical rule, 95% of tires last for between what two values?
- b) How many standard deviations above the mean is a tire that lasts for 58,500 miles?
- c) Determine the probability that a randomly selected tire lasts for more than 58,500 miles.
- d) Determine the mileage for which only 25% of all tires last longer than that mileage. Show how you arrive at your answer.
- e) Suppose the manufacturer wants to issue a money-back guarantee for its tires that fail to achieve a certain number of miles. If they want 99% of the tires to last for longer than the guaranteed number of miles, how many miles should they guarantee? Show how you arrive at your answer.
Parts (a)-(d) are routine questions about the empirical rule, z-scores, and calculating probabilities and percentiles from normal distributions. I think these provide good practice of the basics of what students are to have learned in class that day. Students can use a table of standard normal probabilities, or a calculator with a normal probability function, or a software tool to answer parts (c) and (d).
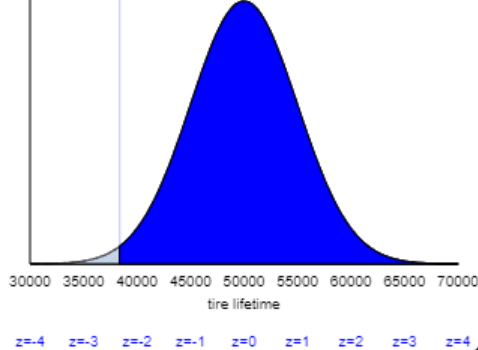
Part (e) is not especially hard, but it does trip up a few students. Can you guess a fairly common mistake that I find very disheartening? The correct z-score is -2.326, so the correct answer for the lifetime to be guaranteed is 50,000 – 2.326×5000 ≈ 38,370 miles. But some students look up the z-score for the 99th percentile and obtain positive 2.326, which produces an answer of 50,000 + 2.326×5000 ≈ 61,630 miles. I always cringe at this response, because these students have not noticed that their calculation does not make sense: This answer would mean that the company would give 99% of customers their money back! I also cringe because these students have neglected to follow my first piece of advice about calculations involving normal distributions: Start with a sketch! If they included with a sketch, they would have seen that only 1% of tire lifetimes exceed 61,630 miles, and 38,370 miles is the value for which 99% exceed that lifetime:
5. Recall the formula for the z-test statistic when conducting a hypothesis test about a proportion:
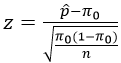
- a) What does the symbol p-hat* represent? (Be as specific as possible.)
- b) What does the symbol pi_0* represent? (Be as specific as possible.)
- c) What does the symbol n represent?
- d) For a given value of n, what happens to the absolute value of the test statistic as the difference between p-hat and pi_0 increases?
- e) For a given value of n, what happens to the p-value as the difference between p-hat and pi_0 increases?
* Students see the symbols rather than the words p-hat and pi_0 here.
Parts (a)-(c) simply ask students to explain what three symbols represent. I grade parts (a) and (b) very strictly. Full credit for part (a) requires saying that the p-hat symbol represents a sample proportion. A response to part (b) must mention a hypothesized value of the population proportion, with all three italicized words required for full credit. I think these are worthwhile questions, because it’s crucial for students to recognize what these symbols mean in order to understand hypothesis testing about a proportion.
Students can think about parts (d) and (e) either conceptually or mathematically. The z-statistic measures the difference between the sample proportion and the hypothesized value of the population proportion in terms of number of standard deviations. A larger difference produces a larger absolute value of the test statistic. A larger difference also provides stronger evidence against the null hypothesis and therefore a smaller p-value.
6. A Harris Poll that surveyed 2225 adult Americans on October 14-19, 2015 found that 29% reported having at least one tattoo.
- a) Is 29% (.29) a parameter or a statistic? What symbol do we use for it?
- b) Determine (by hand) a 95% confidence interval for the relevant parameter.
- c) Interpret this interval: You’re 95% confident that __________ is between ____ and ____ .
- d) How would a 99% confidence interval differ (if at all) from the 95% one? Comment on both the midpoint and width of the interval. (Do not bother to calculate a 99% confidence interval.)
- e) The same Harris Poll also found that 47% of respondents between the ages of 18-35 reported having at least one tattoo. How would a 95% confidence interval for this age group, based on this survey, compare to the 95% confidence interval that you found in part (b)? Comment on both the midpoint and width of the interval.
Parts (a)-(c) ask students to apply what they learned in class to a new study. Notice that I avoid identifying the parameter for them in part (b), because I want students to describe the parameter clearly in their interpretation in part (c), not just repeat back what I’ve already said. I do not always provide the structure for interpreting a confidence interval as in part (c), but I think this is helpful in a quiz setting.
In part (d) most students realize that the confidence interval would become wider with a larger confidence level, and I also want them to note that the midpoint would stay at .29, the value of the sample proportion with a tattoo. Part (e) makes students think, as we did not answer a question like this in class. They need to recognize that the sample size would be smaller for the restricted group, so the confidence interval would become wider. They also need to see that the sample proportion (with a tattoo) is larger for the subgroup, so the midpoint of this interval would be larger than for the original interval.
The word quiz can be very valuable when playing Scrabble, and I find group quizzes to be very valuable for my students’ learning. I fulfill the promise in my syllabi to give lots of quizzes. Most students respond admirably by engaging with each other to support their learning as they discuss and respond to the quiz questions. In next week’s blog post I will provide seven more quizzes, again with five parts each, that I have used with my students.
P.S. The article about predicting elections can be found here. A report on the Harris poll about tattoos can be found here.
P.P.S. I will provide a link to a Word file with these quiz questions, which teachers can modify as they’d like for use with their students, at the end of next week’s post.


Thanks, Allan! Your posts continue to be helpful and insightful. My question with this post has to do with the logistical complications of two quizzes per week on a large class of intro students!! Do you have any magical suggestions for how to facilitate grading, recording, feedback, dropping grades, etc.? Also, how much class time does this take up? And what mechanism do they use for submitting the quiz? Paper? Phone? Computer?
Thanks, Jo
LikeLiked by 1 person
Great questions, Jo, thanks. My quizzes usually take 15-20 minutes of class time, or as few as 10 minutes with a very straightforward quiz. I usually project the questions onto a screen from my laptop, and students write their answers on their own paper (one sheet per group). I have a grader (undergraduate Statistics major) do the grading according to a rubric that I provide. The grader also enters the scores into the course management system (CMS). This works fine when I have sections of 35-50 students per section. Once in a while I have taught sections with 100+ students, and then students submitted quizzes through a course management system. I drop 2-3 quizzes for each student, and I manage that through an Excel file into which I first download scores from the CMS. I post quiz solutions in the CMS shortly after the quiz is taken, in the hope that students will look there for quick feedback. I try to return quizzes in the next class meeting, if the grader can do the grading and return them to me quickly enough. Needless to say, having a dependable grader is very helpful, and I’ve almost always been very fortunate in that regard.
LikeLike
Allan,
Thank you for doing this! It has been reassuring to me that I’ve been doing some of these things, and motivating me to do others that I’ve been overlooking. My courses will be better for having seen these posts.
In this post, your illustration of a “a fine example” answer to 1e seems out in left field to me – was this a cut-and-paste without sufficient proofing, or am I missing something?
Thanks.
Doug Cashing
LikeLike
Thanks very much for reading and for your comment, Doug. I agree that my (lack of) transition to the example response for #1e) was abrupt and confusing. I meant that a student can give an answer such as “time to see a medical professional” for a numerical variable in part (d) and then simply ask about the average value of that variable as a research question in part (e).
LikeLike