#16 Questions about cats
I like cats*. I also notice that it’s simply impossible to spell STATISTICS without the letters C, A, T, and S. These two facts provide more than enough justification for me to ask many questions in class that pertain to cats in one way or another. I believe that the upcoming questions about felines (and their human friends) can help students to learn important concepts in descriptive statistics, probability, and statistical inference**.
* This is one of the shortest sentences that I’ve ever written, even shorter than: Ask good questions.
** If you are more interested in cats than in these statistical concepts, I invite you to skip down to the P.P.S. at the end of this post to see photos of my cats.
I heard Jay Lehmann present the following question at a conference. I liked it so much (not only because it mentions cats) that I began using it on my own final exams:
1a) Which would be larger – the average weight of 10 randomly selected people, or the average weight of 1000 randomly selected cats (ordinary domestic housecats)?
Jay mentioned that some of his students struggle with this question, because they don’t think proportionally. They believe that the weights of 1000 cats must be larger than the weight of 10 people. This would be true, of course, if we were talking about combined weight, but the question asks about average weight, which requires thinking on a per individual (person or cat) basis. There’s no doubt that people weigh more on average than cats.
I’m pleased to say that my students had no difficulty with this question. But I decided to ask a second question:
1b) Which would be larger – the standard deviation of the weights of 1000 randomly selected people, or the standard deviation of the weights of 10 randomly selected cats (ordinary domestic housecats)?
The correct answer, of course, is that the standard deviation would be much larger for people than for cats, because weights of people range from just a few pounds for newborns to hundreds and hundreds of pounds for overweight adults. Cats’ weights range only from a pound or less in kittens to a few dozen pounds for overweight cats.
My students did very poorly on this question. Why? I think they believe that a larger sample size produces a smaller standard deviation, period. I never said that, of course. What I did say, and what we investigated with simulation, is that the standard deviation of a sample mean decreases as the sample size increases. We also explored how the standard deviation of a sample proportion decreases as the sample size increases. We also looked at some formulas that make this more explicit, such as:

I’m afraid that many students came away from these discussions believing that “larger sample sizes produce smaller standard deviations” without paying attention to the crucial of a sample statistic part. In an effort to curb this misunderstanding, I now try to never say or write standard deviation without adding of what for more clarity.
My students’ performance on this question is especially disheartening because I fear that a higher percentage get this wrong on the final exam than would have at the beginning of the course. In other words, I worry that my teaching on this topic is violating the fundamental principle of “first do no harm.”
Oh dear, after a light-hearted introduction, this post has taken a discouraging turn! Let’s move on to happier thoughts about cats (and even dogs) …
The following questions address some basic ideas of working with percentages. You could use these to introduce, or assess students’ understanding of, probabilities of unions of events.
2. The 2018 General Social Survey (GSS) interviewed a national sample of American adults and found that 47% have a pet dog and 25% have a pet cat.
a) Does it necessarily follow that 72% (which is 47% + 25%) of those surveyed had a pet dog or a pet cat? If not, is it even possible (in principle anyway) for this to be true? Under what circumstance (however unrealistic) would this be true?
This conclusion does not follow, because some people have both a pet dog and a pet cat. In other words, having a dog and having a cat are not mutually exclusive. It’s theoretically possible that 72% of those surveyed have a pet dog or a pet cat, but this would only be true if absolutely nobody in the survey had both a dog and a cat.
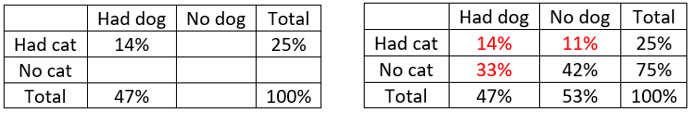
b) The 2018 GSS also found that 14% of survey respondents had both a dog and a cat. What can you conclude about the percentage who had a dog or a cat?
By adding 47% and 25%, we double-count the people who had both a dog and a cat. We can compensate for this double-counting by subtracting off the percentage who had both. The percentage of those surveyed who had a dog or a cat is therefore 47% + 25% – 14% = 58%.
This can be seen by putting the given percentages into the 2×2 table on the left below and then filling in the remaining percentages to produce the table on the right. The filled-in table shows that you can calculate the percentage who had a dog or a cat by adding the three percentages in red, or else (as I did above) by adding the (marginal) percentages for each pet and then subtracting off the (joint) percentage with both pets in order to compensate for double-counting.
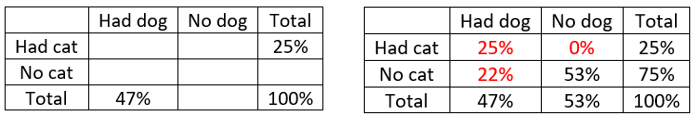
c) If we only knew the percentages in part (a) and not the percentage in part (b), what would be the smallest possible percentage of respondents who owned a pet dog or a pet cat? Describe the (unrealistic) situation in which this extreme case would occur.
This question is very challenging for many students. One way to tackle this is to start with the 2×2 table on the left below. Then realize that to make the percentage with a dog or cat as small as possible, we need to make the percentage in the upper-left cell (with both a dog and a cat) as large as possible. How large can that percentage be? No larger than 25%, the percentage with a cat. The completed table on the right shows that this extreme situation occurs only if none of the respondents had a cat and not a dog. In other words, the most extreme case is that every person with a cat also had a dog, which gives 47% with a dog or a cat, the same as the percentage with a dog.
The following set of questions is one of my favorites (again, not only because it concerns cats). I have long used this example to introduce students to two important ideas in statistical inference: the fundamental distinction between statistical significance and practical importance, and the consistency between confidence intervals and hypothesis tests.
3. The 2012 Statistical Abstract of the United States gives information from a national survey of 47,000 U.S. households in 2006, which found that 32.4% of the households sampled had a pet cat. Consider this as a random sample of American households in 2006.
a) What are the observational units and variable? What type of variable is this?
The observational units are households, not people and not cats. The variable is whether or not the household has a cat, which is … (get ready for it) … a CATegorical variable.
b) Conduct a hypothesis test of whether the sample data provide strong evidence that the population proportion of all American households that had a pet cat in 2006 differed from one-third. Summarize your conclusion.
The z-test statistic is calculated as:

With such a large (in absolute value) z-test statistic, the p-value is very small (about 0.00002). The sample data provide extremely strong evidence that the proportion of all American households that had a pet cat in 2006 was not one-third.
c) Produce and interpret a 99.9% confidence interval for the population proportion of all American households that own a pet cat.
This confidence interval is calculated as:

This becomes .324 ± .007, which is the interval (.317 → .331). We can be 99.9% confident that the population proportion of American households that had a pet cat in 2006 was between .317 and .331.
Parts (a) – (c) provide fairly routine practice. The following parts introduce students to important ideas. I encourage students to think through these questions in groups before I lead a discussion about the answers and what they’re supposed to learn from them. I also caution students to read parts (e) and (f) very carefully to notice the small but important difference in these questions.
d) Are the test decision and confidence interval consistent with each other? Explain.
Yes, these results are consistent. The hypothesis test provided extremely strong evidence that the population proportion is not one-third, and the confidence interval does not include the value one-third (roughly .3333).
e) Do the sample data provide very strong evidence that the population proportion who own a pet cat is not one-third? Explain whether the p-value or confidence interval helps you to decide.
Yes. The p-value is extremely small (approximately .00002), so the sample data provide very strong evidence that the population proportion is not one-third. Whatever this population proportion might equal, we have very strong evidence that it’s not one-third.
f) Do the sample data provide strong evidence that the population proportion who own a pet cat is very different from one-third? Explain whether the p-value or confidence interval helps you to decide.
No. The confidence interval shows us that we can be very confident that the population proportion who had a cat in 2006 is between about .317 and .331. In other words, we can be very confident that between 31.7% and 33.1% of all American households had a pet cat in 2006. In practical terms, this is quite close to one-third, or 33.33%.
g) What aspect of this study is responsible for the somewhat surprising pair of findings that we have very strong evidence that: (1) the population proportion is not one-third, and (2) the population proportion is quite close to one-third?
The driving factor is the very large sample size of 47,000 households. With such a large sample size, even the small difference between the sample percentage (32.4%) and the hypothesized percentage (33.33%) is enough to be statistically significant, meaning that a difference that large would be very unlikely to occur by chance alone. The large sample size also produces a very narrow confidence interval (even with a very high confidence level), so we can be very confident that the population percentage is very close to 32.4%, which in turn is quite close to one-third in practical terms.
The bottom line here is very important for students to understand about statistical inference: With a large sample size, a small difference can be statistically significant but not practically important.
Next comes a series of questions for showing how confidence intervals and hypotheses tests relate when comparing two groups and highlighting the important role of sample size in statistical inference.
4. A national survey of pet owners in the U.S. found that 53% of cat owners and 63% of dog owners said that they would perform CPR on their pets in the event of a medical emergency.
a) Are these numbers parameters or statistics? Explain.
These numbers are statistics, because they describe the sample of dog and cat owners who were surveyed, not all dog and cat owners in the U.S.
b) State the appropriate null and alternative hypotheses for testing whether the difference between 53% and 63% is statistically significant in this context.
The null hypothesis is that the population proportions who would perform CPR on their pet are the same for dog owners and cat owners. The alternative hypothesis is that these population proportions are different. We could represent these hypotheses in symbols as H0: π_dog = π_cat, Ha: π_dog ≠ π_cat.
c) What additional information would you need in order to conduct a test of these hypotheses?
We need to know the sample sizes: how many dog owners and how many cat owners were surveyed? I have to admit that I am incredibly picky when I grade student responses on this question. If a student responds with “sample size,” that only gets partial credit. The response needs to use the plural, because learning the combined sample size is not sufficient information for conducting the test.
d) Suppose for now that the sample sizes had been 100 in each group. Determine the z-score and p-value of the test. Would you reject the null hypothesis at the .05 significance level?
I ask students to use technology to perform the calculations here, so they can focus on the more important concept to be addressed after part (e). A free online tool is available here. The test statistic turns to be z ≈ 1.43, with a two-sided p-value of 0.1520. This p-value is greater than .05, so the observed difference in sample proportions is not statistically significant at the .05 level.
e) Determine and interpret a 95% confidence interval for the difference in the two population proportions.
Again I ask students to use technology for the calculation, which produces a 95% CI of (-0.036 → 0.236). We can be 95% confident that the proportion of all dog owners who would perform CPR is anywhere from .036 smaller to .236 larger than the proportion of all cat owners who would perform CPR.
f) Are the test decision and confidence interval consistent with each other? Explain how you can tell.
Yes, these results are consistent. We did not conclude that the two groups differ, and the confidence interval (for the difference in population proportions) includes the value zero.
g) Now suppose that the sample sizes had been 500 in each group. Determine the z-score and p-value and confidence interval. Summarize your conclusions.
The test statistic becomes z ≈ 3.20, with a two-sided p-value of 0.0014. The 95% CI becomes (0.039 → 0.161). Now we do have strong evidence that dog owners and cat owners differ with regard to the population proportion who would perform CPR on their pets. We can be 95% confident the proportion of all dog owners who would perform CPR is somewhere from .039 to .161 larger than the proportion of all cat owners who would perform CPR.
h) Describe how the p-value and confidence interval changed with the larger sample sizes.
The p-value became much smaller, enough to indicate that the difference in the observed sample proportions was unlikely to have occurred by chance alone. The confidence interval became much narrower, enough that it contains only positive values, indicating that a higher proportion of dog owners than cat owners would perform CPR on their pet in an emergency.
The point here is to help students recognize once again the substantial role that sample size plays in statistical inference.
I promised back in post #6 (here) that I would devote a future post to nothing but questions about cats. I am happy to check this off as a promise kept. I hope that cat-lovers and dog-lovers alike have found something worthwhile in this post. Among their many other benefits to society, cats can help students to learn statistics!
P.S. The percentages from the GSS in question #2 came from a Washington Post article (here). An earlier Washington Post article (here) summarized discrepancies in pet ownership estimates from different sources. The data in question #3 can be found in Table 1241 of the 2012 Statistical Abstract of the United States (here). The survey about performing CPR on pets was summarized in a Los Angeles Times article (here).
P.P.S. I dedicate this post to the three cats who have been provided so much happiness to my wife and me. Our first cat Eponine was a classic scaredy-cat, afraid of her own shadow. She decided early in life that she would never do anything daring but would try to live as long as possible. She succeeded quite well, making it to 23 years and 3 months. On the other hand, Cosette sought adventure and lived every day to the fullest. As a self-respecting calico cat, she became the undisputed, benevolent head of our household from the moment she joined it. Our current cat Puti is a very good-natured boy who loves to purr, sit on laps, and complain that his 6am breakfast is served much too late in the day.

Trackbacks & Pingbacks
- #17 Random babies | Ask Good Questions
- #21 Twenty final exam questions | Ask Good Questions
- #22 Four more exam questions | Ask Good Questions
- #23 Random rendezvous, part 1 | Ask Good Questions
- #41 Hardest topic, part 1 | Ask Good Questions
- #51 Randomness is hard | Ask Good Questions
- #52 Top thirteen topics | Ask Good Questions
- #59 Popularity contest | Ask Good Questions
- #60 Reaching students online | Ask Good Questions
- #75 More final exam questions | Ask Good Questions
- #86 Cars, dogs, tweets | Ask Good Questions


Not to burst your cat bubble there, but there are no Cats in AP Stats
LikeLike
Thanks for reading! My bubble is intact. My cats do not accept “AP Stats” without spelling it out.
LikeLike
And why isn’t the third cat named Fantine????
LikeLike
We thought about Marius and Gavroche as names, but they did not seem to fit. Puti’s name comes from The Number One Ladies’ Detective Agency series, with a slightly different spelling.
LikeLike