#72 Trade-offs
Making good decisions requires assessing trade-offs. We encounter such situations frequently in everyday life as well as in professional settings. As I am deciding what to do with myself at this very moment, I am weighing the trade-offs associated with writing this blog post and watching the Masters golf tournament. If I watch golf, then I will have less time to write this post. Its quality will suffer, and I will need to keep working on this post into Sunday evening. Because I’m a morning person, that means that its quality will suffer even further. But If I write this blog post now instead of watching golf, then I will miss out on a fun diversion that I look forward to every year. What to do? You could argue that I try to do a bit of both, watch golf with one side of my brain and write this post with the other. But multi-tasking is not my strong suit. Because this particular golf tournament only comes around once per year, I think I’ll focus on that for a while. I’ll be back, I promise …
Okay, where was I? While I was away, I realized that you are probably wondering: What does this have to do with teaching statistics? I recently asked my students to complete an assignment based on the activity I presented in post #40, Back to normal (here). This assignment has three goals:
- The immediate goal is for students to develop their ability to perform fairly routine calculations from normal probability distributions, calculating both probabilities and percentiles.
- A secondary goal is to introduce students to the topic of classification problems.
- The big-picture goal is to lead students to think about trade-offs and how decision-making often requires striking a balance between competing interests.
—
Here’s the assignment:
Suppose that a bank uses an applicant’s score based on some criteria to decide whether or not to approve a loan for the applicant. Also suppose that these scores follow normal distributions, both for people who would repay to the loan and for those who would not:
- Those who would repay the loan have a mean of 60 and standard deviation of 8;
- Those who would not repay the loan have a mean of 40 and standard deviation of 12.
Consider this decision rule:
- Approve a loan for applicants with a score above 50.
- Deny the loan for applicants with a score of 50 or below.
- a) Determine the z-score of the cut-off value 50 for each kind of applicant: those who would repay the loan and those who would not. Show how to calculate these two z-scores by hand. Also write a sentence interpreting each z-score.
- b) Determine the probability that an applicant who would repay the loan is denied. Also provide a shaded sketch. (Feel free to use the applet here: www.rossmanchance.com/applets/NormCalc.html.)
- c) Determine the probability that an applicant who would not repay the loan is approved. (Again provide a shaded sketch.)
Now consider changing the cut-off value in the decision rule.
- d) Determine the cut-off value needed to decrease to 0.05 the probability that an applicant who would repay the loan is denied. (Also report the z-score and provide a shaded sketch.)
- e) For this new cut-off value, what is the probability that an applicant who would not repay the loan is approved? (Again report the z-score and provide a shaded sketch.)
- f) Comment on how these two error probabilities with the new cutoff value compare to their counterparts with the original cutoff value.
Now consider changing the cut-off value in the decision rule again.
- g) Determine the cut-off value needed to decrease to 0.05 the probability that an applicant who would not repay the loan is approved? (Again report the z-score and provide a shaded sketch.)
- h) For this new cut-off value, what is the probability that an applicant who would repay the loan is denied. (Again report the z-score and provide a shaded sketch.)
- i) For each of the three cut-off values that have been considered, calculate the average of the two error probabilities. Which cut-off rule is the best according to this criterion?
The following table displays all of the probabilities in this assignment:
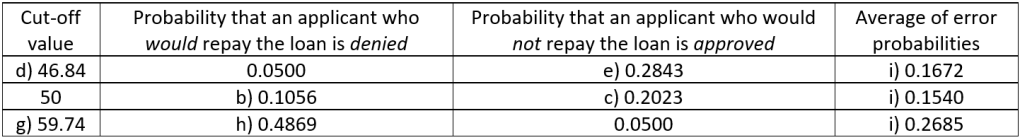
Question (f) is the key one that addresses the issue of trade-offs. I want students to realize that decreasing one of the two error probabilities has the inescapable consequence of increasing the other error probability. Then question (i) asks students to make a decision that balances those trade-offs.
I think this assignment achieves its three goals to some extent. My main concern is that many students struggle to see the big picture about trade-offs. I think many students tend to adopt tunnel-vision, answering one question at a time without looking for connections between them. This is especially true for students who find the meant-to-be-routine calculations to be challenging.
If you compare this assignment to the extensive activity described in post #40 (here), you’ll see that I left out a lot. Why? Because I had to assess trade-offs. I give so many other quizzes and assignments, and the course goes by so quickly on the quarter system, that I thought assigning the full activity would overwhelm students. In hindsight I do wish that I had asked two more questions in the assignment:
- j) Suppose that you regard denying a loan to an applicant who would repay it as three times worse than approving a loan for someone who would not repay it. For each of the three cut-off values, calculate a weighted average of the two error probabilities that assigns weights according to this criterion. Which cut-off rule is the best?
I think this question could have helped students to realize that they need not consider two trade-offs to be equally valuable, that they can incorporate their own judgment and values into consideration. I also think my students could have benefitted from more work with the concept of weighted average.
- k) Now suppose (perhaps unrealistically) that you could change the two probability distributions of scores. What two changes could you make that would enable both error probabilities to decrease? (Hint: Think of one change about their means, another about their standard deviations.)
With this question I would want students to realize that providing more separation between the means of the score distributions would reduce both error probabilities. Reducing the standard deviations of the score distributions would also have this desired effect. I hope that my hint would not make this question too easy and eliminate students’ need to think carefully, but I worry that the question would be too challenging without the hint. I may use a multiple-choice version of this question on the final exam coming up after Thanksgiving.
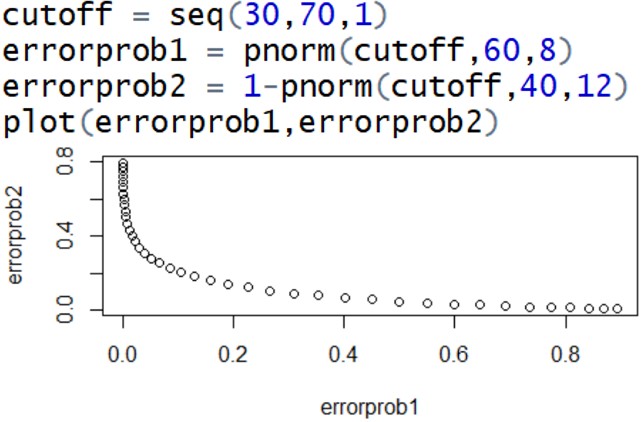
I also wonder whether I should have asked students to produce a graph of one error probability versus the other for many different cut-off values in the decision rule. I have not used R with my business students, but I could have asked them to use Excel. I have in mind something like the following R code and graph:
The issue of trade-offs also arises with other introductory statistics topics. My students learned about confidence intervals recently. Here’s a favorite question of mine: Higher confidence is better than lower confidence, right? So, why do we not always use 99.99% confidence intervals?
The answer is that higher confidence levels produce wider confidence intervals. Higher confidence is good, but wider intervals are bad. In other words, there’s a trade-off between two desirable properties: high confidence and narrow intervals.
With a confidence interval for a population proportion, how many times wider is a 99.99% confidence interval than a 95% confidence interval? The critical values are z* = 1.960 for 95% confidence, z* = 3.891 for 99.99% confidence. This means that a 99.99% confidence interval is 3.891 / 1.960 ≈ 1.985 times wider than a 95% confidence interval.
How can a researcher achieve the best of both worlds – high confidence and a narrow interval? The only way to achieve both is to use a very large sample size. What are some trade-offs associated with a very large sample size? Selecting a very large sample requires much more time, effort, and expense. Also, increasing the sample size come with diminishing returns: You must quadruple the sample size in order to cut the interval’s width in half.
I’m tempted, but have never dared, to ask students to write an essay about how they have assessed trade-offs when making a decision of their own. The COVID-19 crisis, which we are all trying to navigate as best we can, involves many, many trade-offs. My students had to weigh trade-offs in deciding whether to live on campus this term, and they’ll have to do so again as they decide where to live next term. They may have to evaluate trade-offs in deciding whether to go to their grandparents’ house for Thanksgiving dinner. If those topics are too personal, they could also write about much less serious trade-offs, perhaps about their strategy for playing a board or card game, or deciding whether to have a salad or a cheeseburger for lunch. I could also invite students to write about trade-offs from another’s perspective, such as a mayor deciding whether to open or close schools during the COVID-19 crisis, or whether a football coach should “go for it” on fourth down*.
* This article (here) describes how analytics has led some football coaches to revise their conservative strategy on this question.
As you know, I was distracted by watching a golf tournament as I began writing this blog post. While I was watching golf, I was also thinking about trade-offs. Golfers have long debated whether it’s better to strive for distance or accuracy as the more important goal. The trade-off is that you can hit the ball farther if you’re willing to sacrifice some accuracy. On one hand, hitting the ball farther means that you’ll hit your next shot from closer to the hole. But by giving up some accuracy, you’ll more often have to hit your next shot from the rough rather than from the fairway, so you’ll have less ability to control where your next shot goes. On the other hand, prioritizing accuracy means achieving less distance. With more accurate shots, you’ll more often hit your next shot from the smooth fairway where you can control your next shot better, but you’ll be farther from the hole and therefore diminish your chance to hit the next shot close. Much of golf strategy involves navigating this trade-off. The recent push toward analytics in sports has extended to golf, where statisticians gather and analyze lots of data to help players make decisions*.
* This article (here) from last week by golf writer Alan Shipnuck summarizes some of these developments.
And now, if you will excuse me, since the golf tournament is over and I have (ever-so-nearly) finished writing this blog post, I need to check on how my fantasy football team, the Domestic Shorthairs, is doing this week.

