#83 Better, not necessarily good
In this post I will describe a five-question, auto-graded quiz that I recently gave my students. I modified a longer assignment that I have used in the past to create this quiz. I will describe my thinking behind each of these questions, and I will also mention some questions that I decided not to ask. My favorite question on this quiz is the last one, because it tries to assess whether students can take a step back and think about the big picture rather than apply a particular procedure. As always, questions that I pose to students appear in italics.
The quiz begins with this background information:
Helping smokers to quit is a very important and challenging public health goal. In a study of the effectiveness of a nicotine lozenge, smokers who wanted to quit were randomly assigned to one of two groups: one group received nicotine lozenges and the other group received placebo lozenges. At the end of the 52-week study, 17.9% of the 459 subjects in the nicotine group had successfully abstained from smoking, compared to 9.6% of the 458 subjects in the placebo group.
I realize that I have not presented a question yet, but I want to interrupt myself already. I usually present students with a 2×2 table of counts for questions like this about comparing proportions between two groups. But this time I provided the sample sizes and sample proportions (presented as percentages) instead. I think it’s worthwhile to present information in different ways at different times, in the hope that students learn to recognize the underlying structure without becoming too attached to a particular presentation.
To help with recognizing the underlying structure, I repeatedly advise students to start with identifying the observational units and variables*. In this case the observational units are smokers who want to quit, the explanatory variable is whether the person receives a nicotine lozenge or placebo lozenge, and the response variable is whether or not the person successfully abstains from smoking for a year. Both variables are categorical and binary, so that lets students know that they are analyzing a scenario that involves comparing two proportions.
* See post #11, titled Repeat after me, here.
1. How many times more likely was a smoker who received the nicotine lozenge to quit, as compared to a smoker who received a placebo lozenge? Report your answer with two decimal places of accuracy.
This question asks for the ratio of the success proportions, also known as the relative risk. The answer is: 0.179 / 0.096 ≈ 1.86. I specified an error tolerance of 0.02, so students could receive full credit even with some rounding error.
I often ask this question in an alternate form, asking students to fill in the blank in the following sentence: Those who received the nicotine lozenge were ___ % more likely to quit, compared to those who received a placebo lozenge. The answer is 86%, which can be determined by subtracting 1 from the ratio and then multiplying by 100%.
I realize that working with the difference in success proportions is more conventional than calculating the ratio, and the next two questions will ask about this difference. But I think working with percentage differences is an important and challenging skill for students, so I ask this type of question often*.
* See post #28, titled A pervasive pet peeve, here.
2. Calculate the value of the z-test statistic for comparing the success proportions. Report your answer with two decimal places of accuracy.
Students had the option of calculating this by hand or using software, such as the applet (here) that I have used in class. If they are calculating this by hand, they need to use:
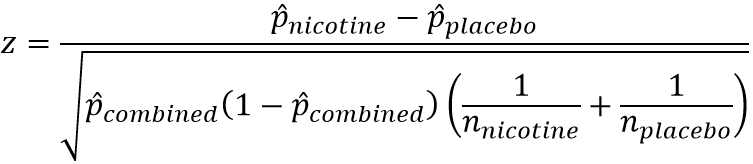
The only component of this calculation that has not been provided is the value of the combined proportion of successes for the two groups. To determine this, students could first produce the 2×2 table of counts:
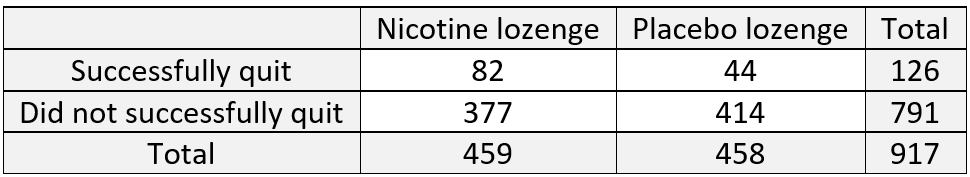
When some students asked about how to determine the combined sample proportion of successes, I mentioned that they could first determine the 2×2 table of counts, but I also pointed them to a shortcut by asking: In what situation does the combined proportion equal the average of the two group proportions? I wanted them to realize that using the average works when the two groups have the same sample size. In this case the two sample sizes are so similar that the average gives a very close approximation for the combined proportion of successes.
The test statistic turns out to be z = 3.63. I allowed an error tolerance of 0.05 to account for rounding errors.
I often ask students to interpret the value of a z-test statistic. Here they could say that the success proportion in the nicotine group is 3.63 standard errors larger than the success proportion in the placebo group. But with only five questions on my quizzes, I omitted that question this time.
3. What kinds of values are in a 95% confidence interval for the difference in population proportions (nicotine minus placebo) who would successfully abstain from smoking for a year? [Options: A. Both negative and positive values; B. Only negative values; C. Only positive values]
Students could answer this question be calculating the confidence interval, either by hand or with software. But they could also answer this based on the z-statistic. A z-statistic of 3.63 is quite far out in the tail of a standard normal distribution, so the p-value is quite close to zero, so the null hypothesis should be resoundingly rejected at the 0.05 significance level. That means that a 95% confidence interval for the difference in population proportions will not include the value zero. Because I stipulated the order of subtraction to be (nicotine minus placebo), and because the nicotine group had a larger proportion of successes than the placebo group, this 95% confidence interval will include only positive values.
I was tempted to ask about a confidence interval for the relative risk, to see whether students would realize that such a confidence interval would include only values larger than one. In hindsight I wish that I had turned question #3 into a two-part matching-style question, with one part asking about a confidence interval for the difference in population proportions and the other asking about a confidence interval for the ratio of population proportions.
4. What conclusion would you draw from this study? [Options: A. Not enough evidence to conclude that the nicotine lozenge is more effective than the placebo lozenge; B. Very strong evidence that the nicotine lozenge is equally effective as the placebo lozenge; C. Very strong evidence that the nicotine lozenge is more effective than the placebo lozenge]
This is the bottom-line question about this study, so I did not consider leaving this out. The correct answer is C. I have been including a version of option B on many questions, to see whether students might be tempted into (inappropriately) accepting the null hypothesis for cases with a larger p-value.
Finally, we arrive at the question that I’ve been intending to highlight all along:
5. If we consider the smokers in this study to be representative of the population of all smokers who want to quit, what would you conclude about the percentage of smokers who would successfully abstain from smoking for one year if they were to take nicotine lozenges? [Options: A. Substantially greater than 50%, B. Substantially less than 50%, C. Very close to 50%]
It’s very tempting to conclude that more than half of all smokers would successfully quit with the nicotine lozenge. After all, the previous questions have led to concluding that the nicotine lozenge is substantially better than the placebo. The z-statistic is very large, so the p-value is very small, so the data provide very strong evidence that the nicotine lozenge is better than the placebo.
It’s also reasonable to conclude that the nicotine lozenge is a good bit better than the placebo. Our point estimate from question #1 is that smokers are 1.86 times more likely to quit if they use the nicotine lozenge rather than the placebo. A 95% confidence interval for the population relative risk extends from 1.32 to 2.62, well above the value 1.
Several students asked me for help with this question. My advice to them was:
- Don’t calculate anything.
- Re-read the sentence about how effective the nicotine lozenge was for the smokers in this study.
- Re-read the question and options.
- Think.
I wanted students to realize that only 17.9% of the smokers who received the nicotine lozenge succeeded in quitting for a year. That’s a lot less than 50%. A 95% confidence interval runs from 14.4% to 21.4%, which is still a lot less than 50%. So, the take-away message is: Being a lot better than a placebo does not necessarily mean being good in an absolute sense. This study indicates that smokers who want to quit have a better chance of success with a nicotine lozenge than with a placebo. But those smokers should not be fooled into thinking that nicotine lozenges move the odds in favor of their successfully quitting. Unfortunately, even with nicotine lozenges, the odds appear to be substantially against successful quitting.
When I used this context on longer, non-auto-graded assignments in the past, I asked students to determine the confidence interval for the population proportion who would successfully quit if given a nicotine lozenge. I think it’s worthwhile to ask students to conduct one-sample inference as part an assignment that’s primarily about two-sample inference. But I like question #5 on this quiz version better, because this just asks students to think without calculating anything. I also like that this quiz version presents the sample percentages of success rather than a table of counts at the outset, so students do not even need to calculate the relevant percentage (17.9%) for themselves.
There you have it: a five-question, auto-graded quiz that I hope leads students to think and not just apply a procedure mindlessly.
Speaking of thinking, may I be so bold as to ask what you think of this quiz? Is it better than asking nothing at all? I hope you do not hesitate to answer yes. Ah, but of course you can truthfully say that this quiz is better than nothing without necessarily thinking that the quiz is good. I’ll be disappointed if you think this, but I’ll also appreciate that you not only grasped my point but also seized an immediate opportunity to apply it.
P.S. The article about the nicotine lozenge study can be found here.


Trackbacks & Pingbacks